. 2012 Jun 8;287(24):20301-12.
doi: 10.1074/jbc.M112.347278. Epub 2012 Mar 30.

Specific domains in yeast translation initiation factor eIF4G strongly bias RNA unwinding activity of the eIF4F complex toward duplexes with 5'-overhangs

Affiliations

Specific domains in yeast translation initiation factor eIF4G strongly bias RNA unwinding activity of the eIF4F complex toward duplexes with 5'-overhangs

Vaishnavi Rajagopal et al. J Biol Chem. .

Abstract

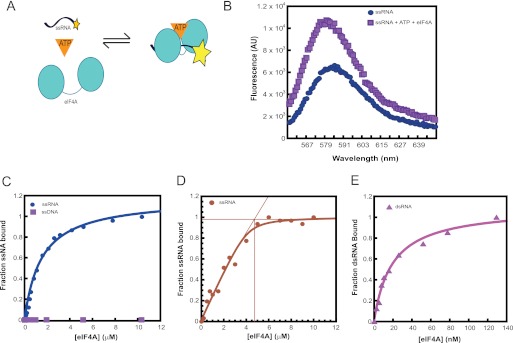
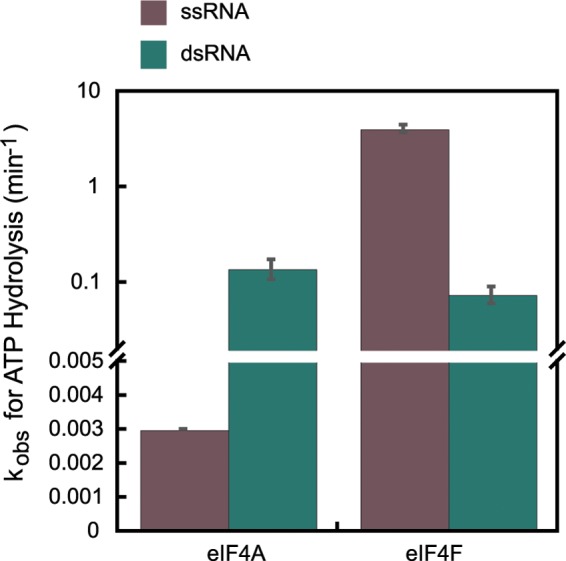
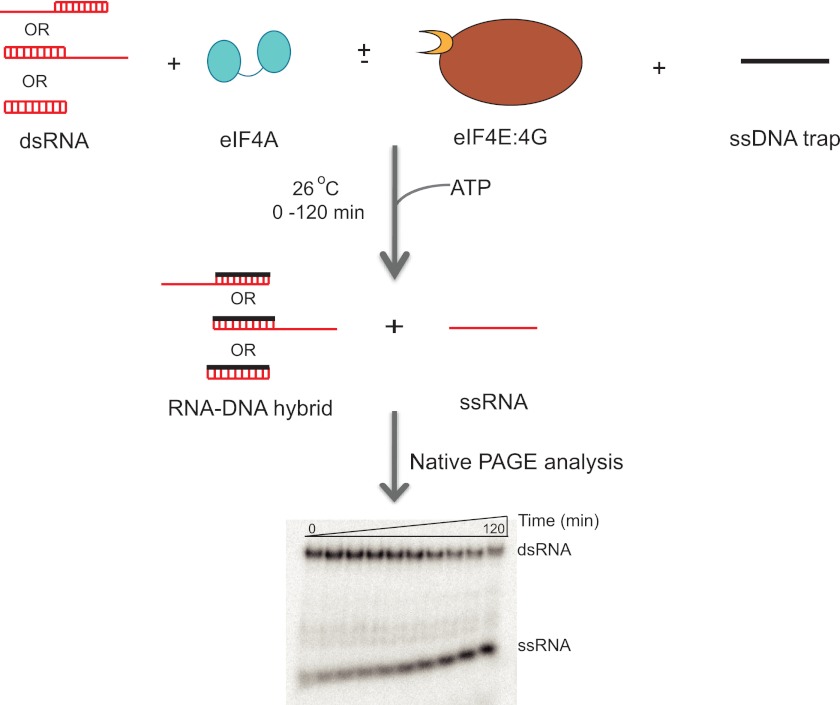
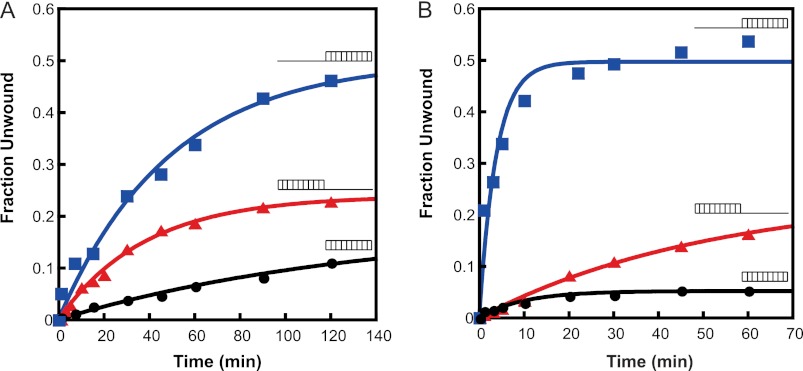
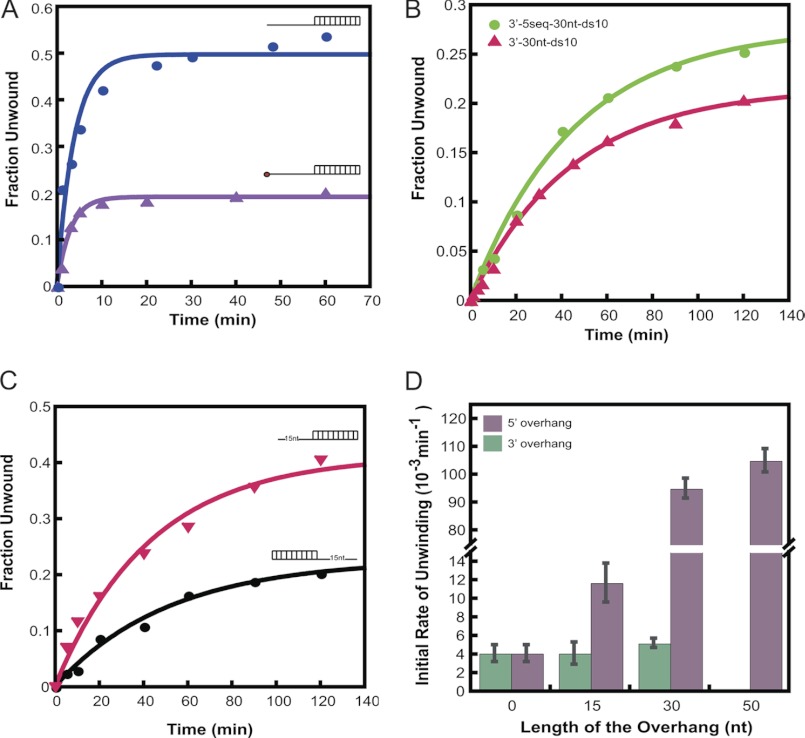
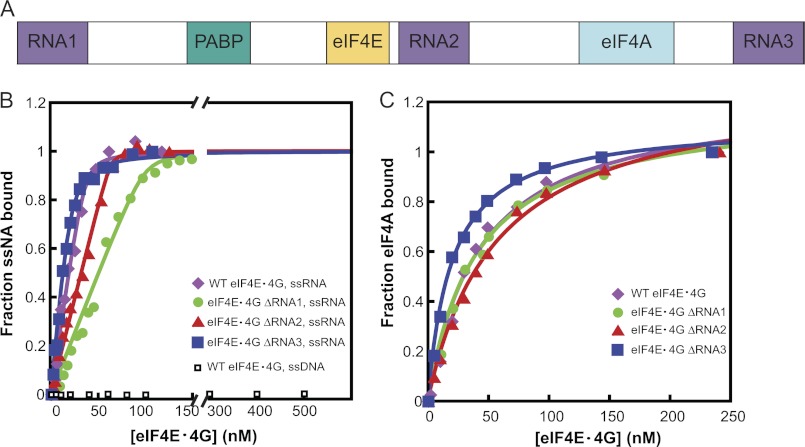
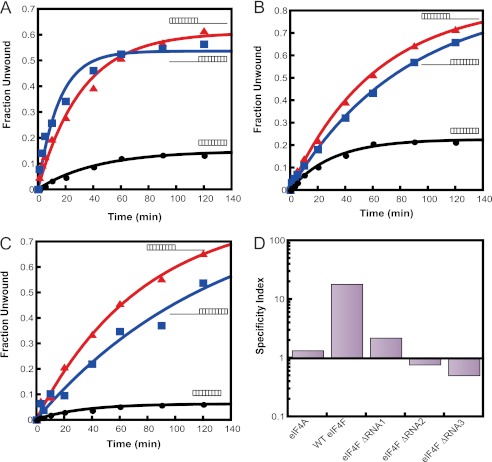
During eukaryotic translation initiation, the 43 S ribosomal pre-initiation complex is recruited to the 5'-end of an mRNA through its interaction with the 7-methylguanosine cap, and it subsequently scans along the mRNA to locate the start codon. Both mRNA recruitment and scanning require the removal of secondary structure within the mRNA. Eukaryotic translation initiation factor 4A is an essential component of the translational machinery thought to participate in the clearing of secondary structural elements in the 5'-untranslated regions of mRNAs. eIF4A is part of the 5'-7-methylguanosine cap-binding complex, eIF4F, along with eIF4E, the cap-binding protein, and the scaffolding protein eIF4G. Here, we show that Saccharomyces cerevisiae eIF4F has a strong preference for unwinding an RNA duplex with a single-stranded 5'-overhang versus the same duplex with a 3'-overhang or without an overhang. In contrast, eIF4A on its own has little RNA substrate specificity. Using a series of deletion constructs of eIF4G, we demonstrate that its three previously elucidated RNA binding domains work together to provide eIF4F with its 5'-end specificity, both by promoting unwinding of substrates with 5'-overhangs and inhibiting unwinding of substrates with 3'-overhangs. Our data suggest that the RNA binding domains of eIF4G provide the S. cerevisiae eIF4F complex with a second mechanism, in addition to the eIF4E-cap interaction, for directing the binding of pre-initiation complexes to the 5'-ends of mRNAs and for biasing scanning in the 5' to 3' direction.


Figures

FIGURE 1.
FIGURE 1.
Equilibrium binding of eIF4A to RNA substrates. A, schematic representation of the fluorescence-based assay to monitor eIF4A binding to RNA. B, emission wavelength scan of 3′-TAMRA-labeled RNA alone (●) or eIF4A·RNA·ATP complex (■). The excitation wavelength was 550 nm. eIF4A binding to RNA results in an enhancement in the fluorescence intensity with a peak around 585 nm. C, equilibrium binding curves for eIF4A and ssRNA or ssDNA. Increasing concentrations of eIF4A were titrated against 5 nm ssRNA in the presence of 5 mm ATP. D, stoichiometry of eIF4A binding to ssRNA. Increasing concentrations of eIF4A were titrated against 5 μm ssRNA, in the presence of 5 mm ATP. E, equilibrium binding curve for eIF4A and dsRNA. Increasing concentrations of eIF4A were titrated against 5 nm dsRNA, in the presence of 5 mm ATP. C–E, the fraction bound was plotted as a function of increasing eIF4A concentrations to obtain the binding curves for the interaction between eIF4A and RNA. C and E, the data were fit with an equation for hyperbolic ligand binding to obtain the equilibrium binding constant for eIF4A and the different RNA substrates. D, data were fit with the quadratic form of the binding equation because the concentration of labeled ssRNA was greater than the Kd value. eIF4A binds to ssRNA with a Kd of ∼1.5 μm and a stoichiometry of 1:1. It binds dsRNA with a Kd of ∼20 nm. All binding experiments were carried out in “Recon buffer” containing 30 mm HEPES-KOH, pH 7.4, 3 mm Mg(OAc)2, 2 mm dl-dithiothreitol (DTT), and 100 mm KOAc, at 26 °C.
FIGURE 2.
FIGURE 2.
Steady-state ATPase activities of eIF4A and eIF4F. ATPase activities of WT eIF4A and eIF4F were measured as described under “Experimental Procedures.” Briefly, ATP (5 mm) was added to the reaction mixture containing eIF4A or eIF4F (200 nm) with saturating single-stranded or double-stranded nucleic acids substrates (5 μm). The reaction was allowed to proceed for 0–180 min at 26 °C in Recon buffer. The reaction was quenched with formic acid, and the products were resolved by polyethyleneimine-cellulose TLC and quantified using ImageQuant. The molar ATP hydrolyzed per molar enzyme was plotted as a function of time. The data were fit with an equation for a straight line. The slope of this line gave the initial rate of ATP hydrolysis. The ATPase rates reported here have been corrected for the low level of background ATPase observed in the absence of any nucleic acid (see “Experimental Procedures”).
FIGURE 3.
FIGURE 3.
Schematic representation of the RNA unwinding assay. A flow chart of the RNA unwinding assay. Briefly, the dsRNA substrate (10 nm) was incubated with eIF4A (100 nm, with or without 300 nm eIF4E·eIF4G) and DNA trap (3 μm). The DNA trap has the same sequence as the labeled RNA oligonucleotide (top strand of duplexes in red) and serves to prevent reannealing of the two RNA strands after unwinding. The unwinding reaction was initiated by the addition of ATP (3 mm). The time course (0–120 min) was monitored at 26 °C and analyzed by native PAGE cooled with a circulating water bath. A representative unwinding gel is shown here. The gel was scanned and quantified using a PhosphorImager. As with the RNA binding and ATPase, the reaction was carried out in Recon buffer.
FIGURE 4.
FIGURE 4.
Substrate specificity of RNA unwinding by eIF4A and eIF4F. The RNA unwinding activities of eIF4A and eIF4F were measured with three different unwinding substrates (Table 1). Conditions were the same as in Fig. 3. A, representative plot of the unwinding kinetics of eIF4A with the different RNA duplexes. B, representative plot for the unwinding kinetics of WT eIF4F with the different RNA duplexes. The substrates used (Table 1) are schematically represented next to each time course. The initial rates of unwinding (Table 3) were obtained using the slope of the linear portion of the exponential plots.
FIGURE 5.
FIGURE 5.
Effect of a 5′-cap and ssRNA sequence on RNA unwinding by eIF4F. The RNA unwinding activity of wild-type eIF4F was measured with different dsRNA substrates (Table 1). A, eIF4F-catalyzed unwinding of 5′-30-nt-ds10 substrate (Table 1) with (▴) or without (●) a 5′-7mG cap. B, comparison of eIF4F-catalyzed unwinding of a 10-bp duplex with two different 30-nt 3′-overhangs. The kinetics of unwinding are the same with the standard 3′-overhang (3′-30-nt-ds10; Table 1 (▴)) and one that is identical to the 30-nt single-stranded region of the 5′-overhang dsRNA substrate (3′-5 seq-30 nt-ds 10; Table 1 (●)). C, eIF4F-catalyzed unwinding of a 10-bp duplex substrate with a 15-nt 5′-overhang (▾) and a 15-nt 3′-overhang (●) (Table 1). D, dependence of eIF4F unwinding rate upon lengths of 3′- or 5′-overhangs. The unwinding rate of a 10-bp duplex with a 50-nt 3′-overhang was not measured. Conditions were the same as in Fig. 3.
FIGURE 6.
FIGURE 6.
ssRNA and eIF4A binding to eIF4G RNA domain deletion mutants. A, schematic representation of yeast eIF4G, showing the locations of the RNA binding domains (RNA1–RNA3), the canonical PABP-binding domain (PABP), the eIF4E-binding domain (eIF4E), and the eIF4A-binding domain (eIF4A). B, equilibrium binding constants (Kd) for ssRNA and the different ΔRNA domain mutants of eIF4G were measured using fluorescence anisotropy as described under “Experimental Procedures.” Briefly, the change in fluorescence anisotropy of 75.1-Fl RNA (Table 1) was monitored as a function of increasing concentrations of WT eIF4E·eIF4G or ΔRNA mutants. The curves were then fit with a quadratic binding equation to obtain the Kd value for the interaction between eIF4E·eIF4G and ssRNA. All the mutants bound to ssRNA very tightly, with Kd values ≤30 nm. Because of this tight binding, only upper limits for Kd values could be obtained. The inflection point of the curve indicates 1:1 binding between the WT eIF4E·eIF4G complex and the ssRNA. WT eIF4E·eIF4G did not bind detectably to ssDNA. C, Kd value for binding of eIF4A to the different ΔRNA mutants of eIF4E·eIF4G was measured using fluorescence anisotropy as described under “Experimental Procedures.” Briefly, the change in fluorescence anisotropy of TAMRA-labeled eIF4A was monitored as a function of increasing concentrations of eIF4E·eIF4G ΔRNA mutants. The titration curves were then fit with a hyperbolic ligand binding equation to obtain the Kd value for eIF4E·eIF4G and eIF4A. All mutants bound eIF4A with Kd ≤30 nm. B and C, ●, eIF4E·eIF4G ΔRNA1; ▴, eIF4E·eIF4G ΔRNA2; ■, eIF4E·eIF4G ΔRNA3; and ♦, WT eIF4E·eIF4G. B, □, WT eIF4E·eIF4G binding to ssDNA. The experiments were performed at 26 °C in Recon buffer. The concentrations of labeled ssRNA and eIF4A were each 30 nm in B and C, respectively.
FIGURE 7.
FIGURE 7.
Substrate specificity of mutant eIF4F complexes. The RNA unwinding activities of the eIF4F ΔRNA mutants were measured with three different substrates (Table 1). Representative time courses of unwinding are shown with the different RNA duplexes catalyzed by eIF4F ΔRNA1 (A), eIF4F ΔRNA2 (B), and eIF4F ΔRNA3 (C). The substrates are schematically represented next to each time course. The unwinding rate constants (Table 3) were obtained by fitting each plot to a first-order exponential equation. D, specificity index, defined as the ratio of the unwinding rate constant for the duplex with the 30-nt 5′-overhang to that of the duplex with the 30-nt 3′-overhang, for each eIF4F complex. A specificity index >1 indicates a preference for unwinding the duplex with the 5′-overhang and a value <1 indicates a preference for the duplex with the 3′-overhang. Conditions were as in Fig. 3, except in experiments with eIF4F ΔRNA1 500 nm eIF4E·eIF4G was used.

Similar articles

Cited by

References

    1. Lorsch J. R., Dever T. E. (2010) Molecular view of 43 S complex formation and start site selection in eukaryotic translation initiation. J. Biol. Chem. 285, 21203–21207 - PMC - PubMed
    1. Jackson R. J., Hellen C. U., Pestova T. V. (2010) The mechanism of eukaryotic translation initiation and principles of its regulation. Nat. Rev. Mol. Cell Biol. 11, 113–127 - PMC - PubMed
    1. Hinnebusch A. G. (2011) Molecular mechanism of scanning and start codon selection in eukaryotes. Microbiol. Mol. Biol. Rev. 75, 434–467 - PMC - PubMed
    1. Parsyan A., Svitkin Y., Shahbazian D., Gkogkas C., Lasko P., Merrick W. C., Sonenberg N. (2011) mRNA helicases. The tacticians of translational control. Nat. Rev. Mol. Cell Biol. 12, 235–245 - PubMed
    1. Gorbalenya A. E., Koonin E. V. (1993) Helicases. Amino acid sequence comparisons and structure-function relationships. Curr. Opin. Struct. Biol. 3, 419–429

Publication types

MeSH terms

LinkOut - more resources