

Sequential ChIP-bisulfite sequencing enables direct genome-scale investigation of chromatin and DNA methylation cross-talk
- PMID: 22466170
- PMCID: PMC3371717
- DOI: 10.1101/gr.133728.111
Sequential ChIP-bisulfite sequencing enables direct genome-scale investigation of chromatin and DNA methylation cross-talk
Abstract
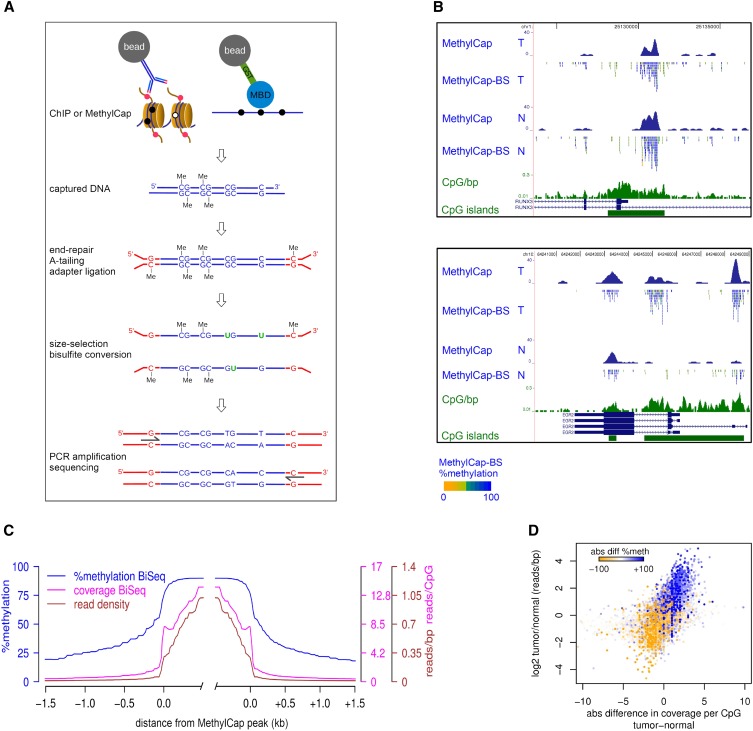
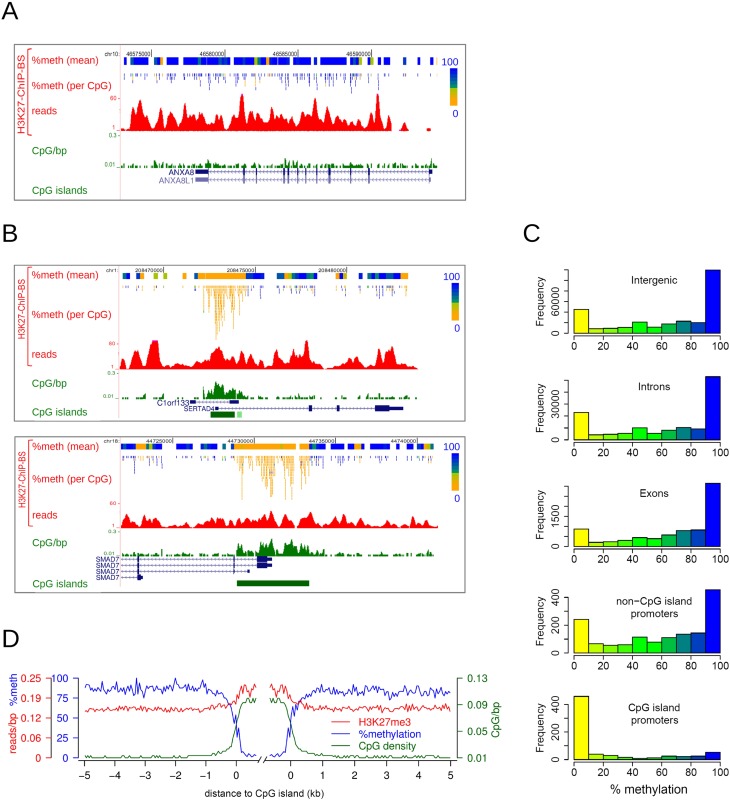
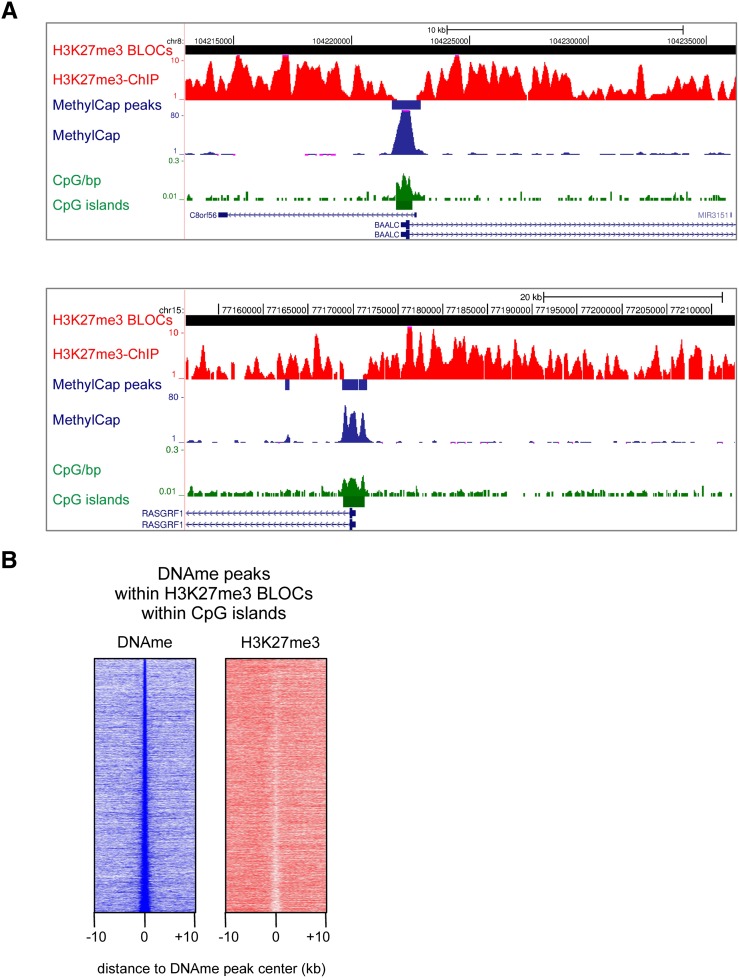
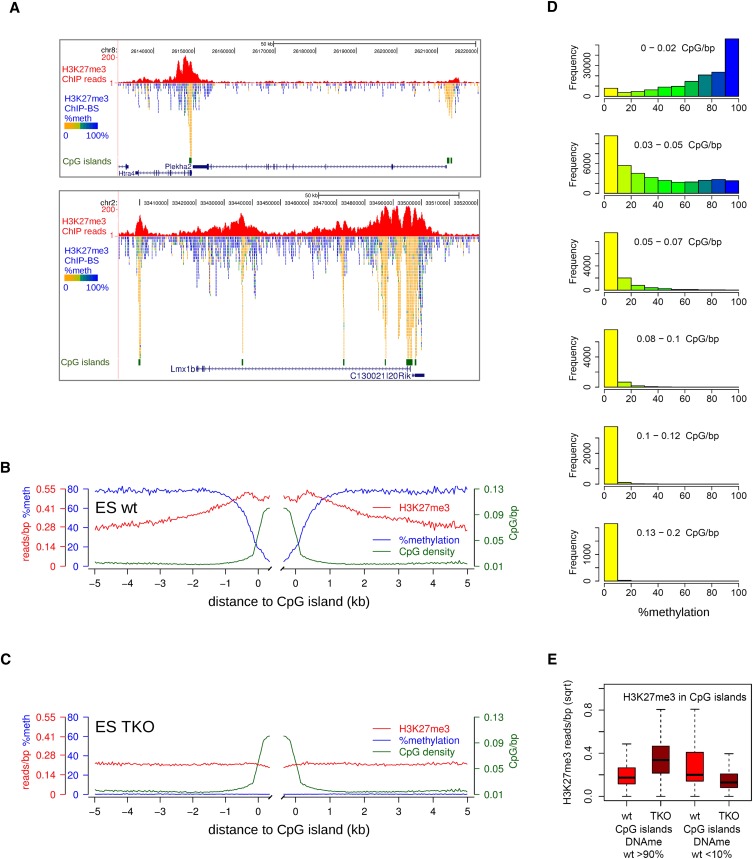
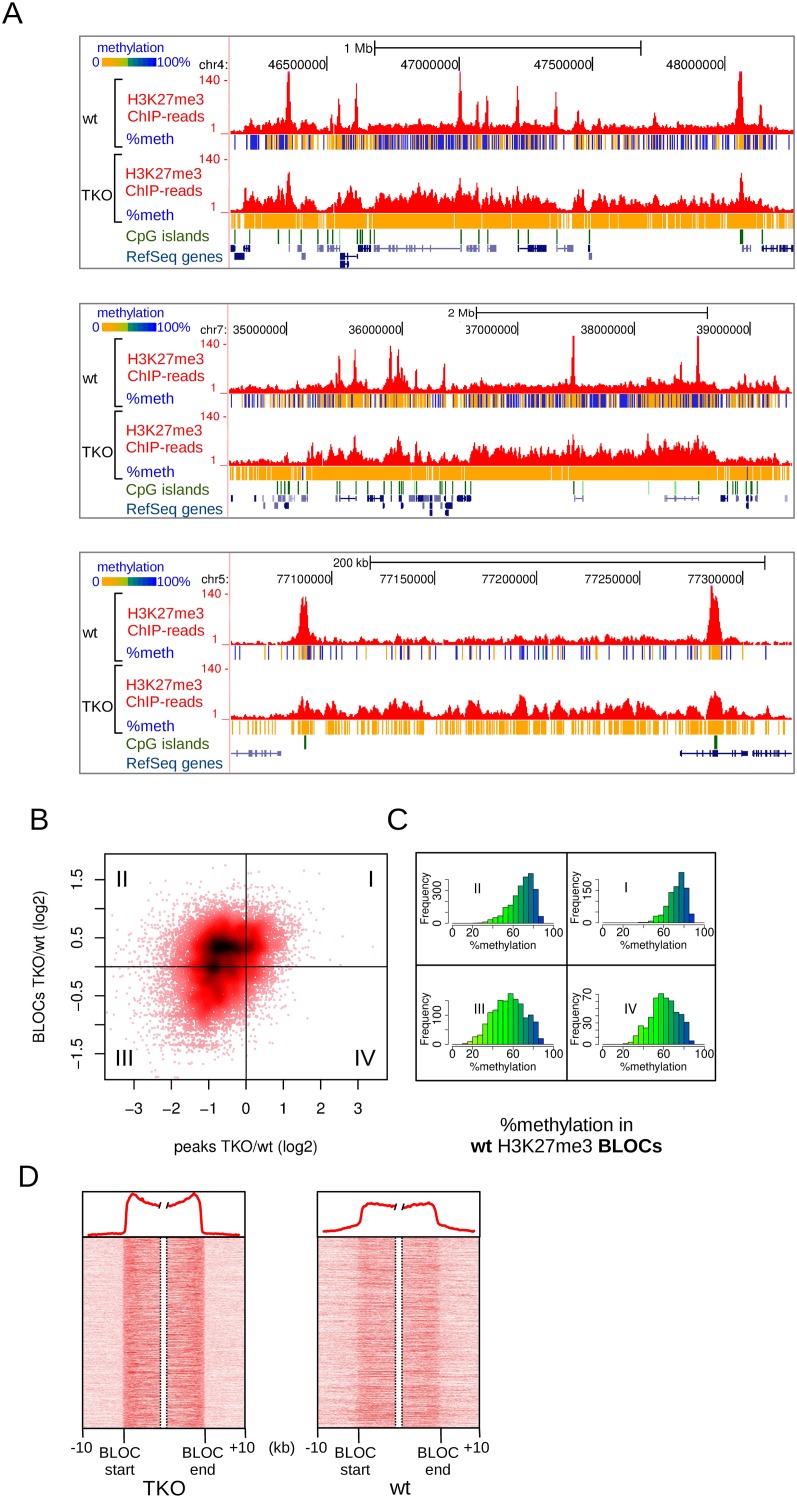
Cross-talk between DNA methylation and histone modifications drives the establishment of composite epigenetic signatures and is traditionally studied using correlative rather than direct approaches. Here, we present sequential ChIP-bisulfite-sequencing (ChIP-BS-seq) as an approach to quantitatively assess DNA methylation patterns associated with chromatin modifications or chromatin-associated factors directly. A chromatin-immunoprecipitation (ChIP)-capturing step is used to obtain a restricted representation of the genome occupied by the epigenetic feature of interest, for which a single-base resolution DNA methylation map is then generated. When applied to H3 lysine 27 trimethylation (H3K27me3), we found that H3K27me3 and DNA methylation are compatible throughout most of the genome, except for CpG islands, where these two marks are mutually exclusive. Further ChIP-BS-seq-based analysis in Dnmt triple-knockout (TKO) embryonic stem cells revealed that total loss of CpG methylation is associated with alteration of H3K27me3 levels throughout the genome: H3K27me3 in localized peaks is decreased while broad local enrichments (BLOCs) of H3K27me3 are formed. At an even broader scale, these BLOCs correspond to regions of high DNA methylation in wild-type ES cells, suggesting that DNA methylation prevents H3K27me3 deposition locally and at a megabase scale. Our strategy provides a unique way of investigating global interdependencies between DNA methylation and other chromatin features.
Figures
Comment in
-
Sequencing: Probing epigenetic cross-talk.Nat Methods. 2012 Jun;9(6):538. doi: 10.1038/nmeth.2063. Nat Methods. 2012. PMID: 22874993 No abstract available.
Similar articles
-
Bisulfite sequencing of chromatin immunoprecipitated DNA (BisChIP-seq) directly informs methylation status of histone-modified DNA.Genome Res. 2012 Jun;22(6):1120-7. doi: 10.1101/gr.132076.111. Epub 2012 Mar 30. Genome Res. 2012. PMID: 22466171 Free PMC article.
-
Distinct features of H3K4me3 and H3K27me3 chromatin domains in pre-implantation embryos.Nature. 2016 Sep 22;537(7621):558-562. doi: 10.1038/nature19362. Epub 2016 Sep 14. Nature. 2016. PMID: 27626379
-
H3K27me3 forms BLOCs over silent genes and intergenic regions and specifies a histone banding pattern on a mouse autosomal chromosome.Genome Res. 2009 Feb;19(2):221-33. doi: 10.1101/gr.080861.108. Epub 2008 Dec 1. Genome Res. 2009. PMID: 19047520 Free PMC article.
-
Histone 3 Lysine 27 Trimethylation Signature in Breast Cancer.Int J Mol Sci. 2021 Nov 27;22(23):12853. doi: 10.3390/ijms222312853. Int J Mol Sci. 2021. PMID: 34884658 Free PMC article. Review.
-
Integrating ChIP-seq with other functional genomics data.Brief Funct Genomics. 2018 Mar 1;17(2):104-115. doi: 10.1093/bfgp/ely002. Brief Funct Genomics. 2018. PMID: 29579165 Free PMC article. Review.
Cited by
-
DNA methylation shapes the Polycomb landscape during the exit from naive pluripotency.Nat Struct Mol Biol. 2024 Oct 24. doi: 10.1038/s41594-024-01405-4. Online ahead of print. Nat Struct Mol Biol. 2024. PMID: 39448850
-
Single-molecule analysis of combinatorial epigenomic states in normal and tumor cells.Proc Natl Acad Sci U S A. 2013 May 7;110(19):7772-7. doi: 10.1073/pnas.1218495110. Epub 2013 Apr 22. Proc Natl Acad Sci U S A. 2013. PMID: 23610441 Free PMC article.
-
Dynamic DNA methylation across diverse human cell lines and tissues.Genome Res. 2013 Mar;23(3):555-67. doi: 10.1101/gr.147942.112. Epub 2013 Jan 16. Genome Res. 2013. PMID: 23325432 Free PMC article.
-
An epigenetic hypothesis for the genomic memory of pain.Front Cell Neurosci. 2015 Mar 24;9:88. doi: 10.3389/fncel.2015.00088. eCollection 2015. Front Cell Neurosci. 2015. PMID: 25852480 Free PMC article.
-
ATRX Plays a Key Role in Maintaining Silencing at Interstitial Heterochromatic Loci and Imprinted Genes.Cell Rep. 2015 Apr 21;11(3):405-18. doi: 10.1016/j.celrep.2015.03.036. Epub 2015 Apr 9. Cell Rep. 2015. PMID: 25865896 Free PMC article.
References
-
- Barski A, Cuddapah S, Cui K, Roh T-Y, Schones DE, Wang Z, Wei G, Chepelev I, Zhao K 2007. High-resolution profiling of histone methylations in the human genome. Cell 129: 823–837 - PubMed
-
- Bell AC, Felsenfeld G 2000. Methylation of a CTCF-dependent boundary controls imprinted expression of the Igf2 gene. Nature 405: 482–485 - PubMed
-
- Brinkman AB, Simmer F, Ma K, Kaan A, Zhu J, Stunnenberg HG 2010. Whole-genome DNA methylation profiling using MethylCap-seq. Methods 52: 232–236 - PubMed
Publication types
MeSH terms
Substances
Associated data
- Actions
Grants and funding
LinkOut - more resources
Full Text Sources
Other Literature Sources
Molecular Biology Databases