. 2012 May 11;287(20):16563-74.
doi: 10.1074/jbc.M111.262154. Epub 2012 Mar 26.

Roles of N-acetylglucosaminyltransferase III in epithelial-to-mesenchymal transition induced by transforming growth factor β1 (TGF-β1) in epithelial cell lines

Affiliations

Roles of N-acetylglucosaminyltransferase III in epithelial-to-mesenchymal transition induced by transforming growth factor β1 (TGF-β1) in epithelial cell lines

Qingsong Xu et al. J Biol Chem. .

Abstract

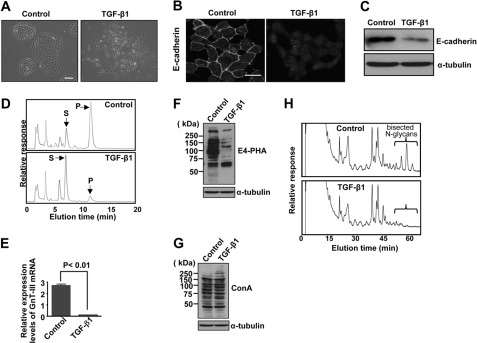
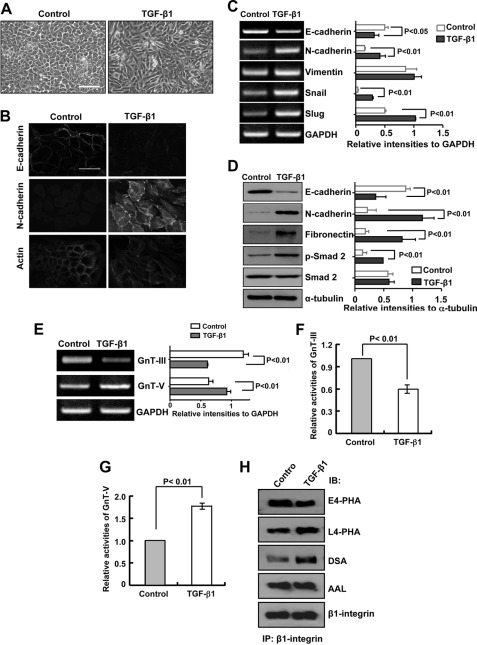
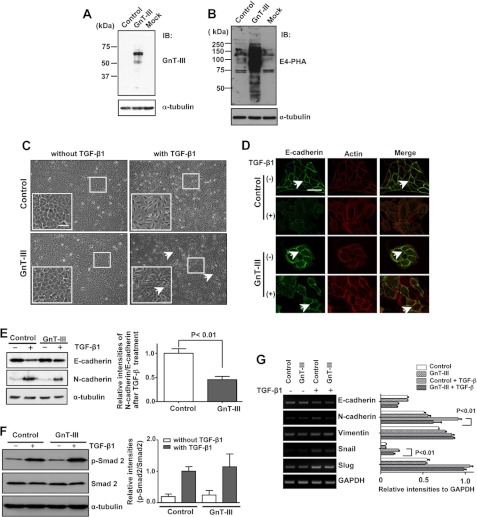
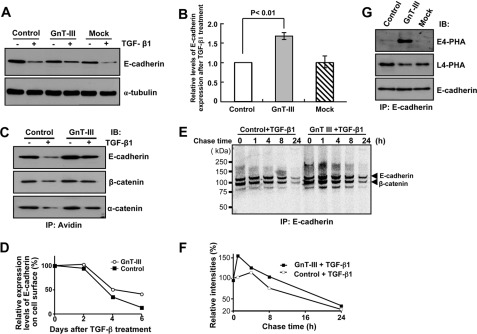
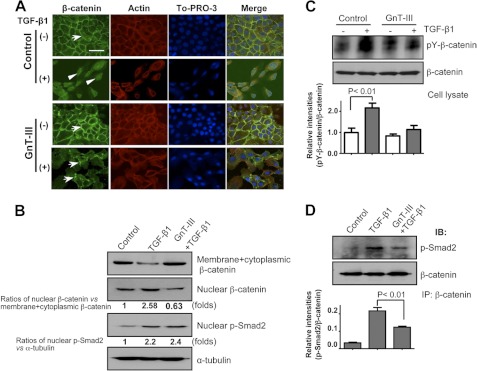
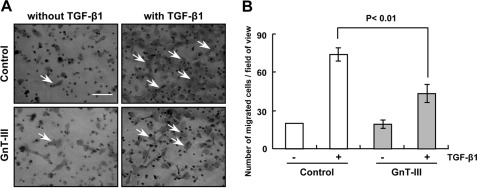
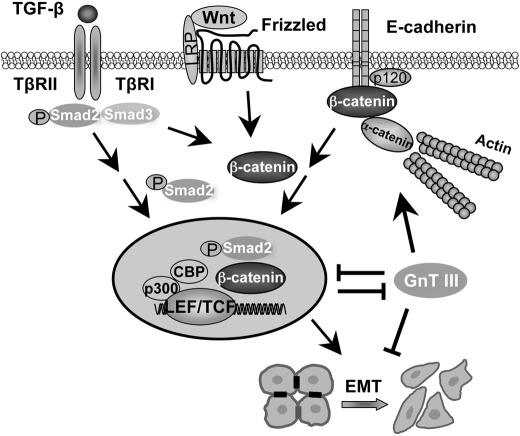
The epithelial-to-mesenchymal transition (EMT) plays crucial roles in embryonic development, wound healing, tissue repair, and cancer progression. Results of this study show how transforming growth factor β1 (TGF-β1) down-regulates expression of N-acetylglucosaminyltransferase III (GnT-III) during EMT-like changes. Treatment with TGF-β1 resulted in a decrease in E-cadherin expression and GnT-III expression, as well as its product, the bisected N-glycans, which was confirmed by erythro-agglutinating phytohemagglutinin lectin blot and HPLC analysis in human MCF-10A and mouse GE11 cells. In contrast with GnT-III, the expression of N-acetylglucosaminyltransferase V was slightly enhanced by TGF-β1 treatment. Changes in the N-glycan patterns on α3β1 integrin, one of the target proteins for GnT-III, were also confirmed by lectin blot analysis. To understand the roles of GnT-III expression in EMT-like changes, the MCF-10A cell was stably transfected with GnT-III. It is of particular interest that overexpression of GnT-III influenced EMT-like changes induced by TGF-β1, which was confirmed by cell morphological changes of phase contrast, immunochemical staining patterns of E-cadherin, and actin. In addition, GnT-III modified E-cadherin, which served to prolong E-cadherin turnover on the cell surface examined by biotinylation and pulse-chase experiments. GnT-III expression consistently inhibited β-catenin translocation from cell-cell contact into the cytoplasm and nucleus. Furthermore, the transwell assay showed that GnT-III expression suppressed TGF-β1-induced cell motility. Taken together, these observations are the first to clearly demonstrate that GnT-III affects cell properties, which in turn influence EMT-like changes, and to explain a molecular mechanism for the inhibitory effects of GnT-III on cancer metastasis.


Figures

FIGURE 1.
FIGURE 1.
Effects of TGF-β1 on cell morphology, E-cadherin expression, and changes in N-glycans in GE11 cells. GE11 cells were grown in 6-well (2 × 10⁵) or bottom dishes (2 × 10⁴) for 24 h and then replaced with fresh complete medium with or without TGF-β1 (5 ng/ml) for another 4 days of incubation. A, cell morphology of the indicated cells was photographed. Photographs were taken of living cells using a ×10 objective. Scale bar, 100 μm. B, E-cadherin expressed on the cell surface was stained with anti-E-cadherin primary antibody, followed by incubation with Alexa Fluor-conjugated secondary antibody. Scale bar, 25 μm. C, total expression levels of E-cadherin were analyzed using Western blotting. Cell lysates from those cells were immunoblotted with anti-E-cadherin antibody. D, equal amounts of cell lysate proteins (20 μg) were used as the enzymatic source for the examination of GnT-III activities. S, substrate; P, product. E, mRNA expression of GnT-III. Quantitative RT-PCR was performed by monitoring in real time the increase in fluorescence of the SYBR Green dye on an ABI StepOnePlus. The mean number of cycles to the threshold (CT) of fluorescence detection was calculated for each sample, and the results were normalized to the mean CT of GAPDH for each sample tested. The changes in N-glycans were detected by E4-PHA (F) and concanavalin A (ConA) (G) lectin blot. α-Tubulin was used as a load control. H, N-glycans of GE11 cells cultured under normal conditions and treated with (bottom) or without (top) TGF-β for 4 days were released with peptide:N-glycosidase F (PNGaseF), as described under “Experimental Procedures,” digested with sialidase, and subjected to reversed-phase HPLC. The elution times for those PA-bisected N-glycans were compared with standard PA-N-glycans.
FIGURE 2.
FIGURE 2.
TGF-β1-induced EMT in MCF10A cells. A, MCF10A cells underwent morphological changes in response to TGF-β1 treatment as described in Fig. 1. Photographs were taken of living cells using a ×10 objective. Scale bar, 100 μm. B, cells treated with or without TGF-β1 were stained with anti-E-cadherin and N-cadherin primary antibodies, followed by incubation with Alexa Fluor-conjugated secondary antibody. Localization of F-actin was examined by staining with Alexa Fluor 488 phalloidin. Scale bar, 50 μm. C, RT-PCR using total RNA extracted from untreated (control) and TGF-β1-treated cells was carried out to examine the expression levels of E-cadherin, N-cadherin, vimentin, Snail, and Slug. The expression level of GAPDH was used as a load control. The relative ratios (each gene versus GAPDH) are shown in the right panel. The p values were calculated using Student's two-tailed t test. Error bars indicate the standard deviation. D, cell lysates from those cells were immunoblotted (IB) with anti-E-cadherin, N-cadherin, fibronectin, p-Smad2, and Smad2 antibodies. α-Tubulin was used as a load control. The relative ratios (each protein versus α-tubulin) are shown in the right panel. The p values were calculated using Student's two-tailed t test. Error bars indicate S.D. E, MCF 10A cells were cultured with or without TGF-β1 (5 ng/ml) for 4 days. The effects of TGF-β1 on expression of GnT-III and GnT-V were examined using RT-PCR, and the relative ratios are shown in the right panel. The quantitative data were obtained from three independent experiments. The p values were calculated using Student's two-tailed t test. Error bars indicate S.D. Equal amounts of cell lysates (20 μg) were used as the enzymatic source for assaying GnT-III and GnT-V activities. The relative activities of GnT-III (F) and GnT-V (G) are shown as folds, in which the activity for control cells without TGF-β1 treatment was set as 1. All of these quantitative data were obtained from three independent experiments. The p values were calculated using Student's two-tailed t test. Error bars indicate S.D. H, cell lysates from cells treated with or without TGF-β1 were immunoprecipitated (IP) using anti-β1 integrin antibody. Immunoprecipitates were run on a 7.5% SDS-polyacrylamide gel and probed with the biotinylated E4-PHA, L4-PHA, D. stramonium (DTA), and A. aurantia (AAL) lectins. The same amounts of protein loaded were verified by probing with anti-β1 integrin antibody.
FIGURE 3.
FIGURE 3.
Effects of GnT-III expression on cell morphological changes and cellular signaling in TGF-β-induced EMT. GnT-III expression vector and vector only were transfected into MCF10A cells using the Phoenix retrovirus system, and stable expression cells were established as described under “Experimental Procedures.” Cells were harvested and lysed for immunoblotting (IB). Equal amounts of protein (5 μg) were separated on 7.5% SDS-PAGE under reducing conditions, and the membranes were probed with antibody against GnT-III (A) and with the E4-PHA lectin (B). α-Tubulin was used as a loading control. C, wild-type MCF10A and GnT-III-expressing MCF10A cells underwent morphological changes in response to TGF-β 1 treatment as described in Fig. 1. Photographs were taken of living cells using a ×10 objective. Insets, representative cell morphology. Arrows indicate aggregated cells. Scale bar, 100 μm. D, indicated cells treated with or without TGF-β1 were stained with anti-E-cadherin antibody, followed by incubation with Alexa Fluor-conjugated secondary antibody. Localization of F-actin was examined by staining with Alexa Fluor 488 phalloidin. The arrows indicate E-cadherin expressed in the cell-cell contact. Scale bar, 50 μm. E, cell lysates from those cells were immunoblotted with anti-E-cadherin, N-cadherin, and α-tubulin antibodies (left panel). The relative intensity was a ratio of N-cadherin versus E-cadherin after TGF-β1 treatment (right panel). The p value was calculated using Student's two-tailed t test. Error bars indicate S.D. F, cell lysates were immunoblotted anti-pSmad2, Smad2, and α-tubulin antibodies (left panel). The relative intensity was a ratio of p-Smad2 versus Smad2 (right panel). The quantitative data were obtained from three independent experiments. α-Tubulin was used as a load control. G, RT-PCR using total RNA extracted from untreated and TGF-β1-treated control or GnT-III-expressing cells was carried out to examine the expression levels of E-cadherin, N-cadherin, vimentin, Snail, and Slug. The expression level of GAPDH was used as a load control. The relative ratios (each gene versus GAPDH) are shown in the right panel. The p value was calculated using Student's two-tailed t test. Error bars indicate S.D. Control, wild-type MCF 10A cells; GnT-III, cells transfected with GnT-III; Mock, cells transfected with vector only.
FIGURE 4.
FIGURE 4.
Effects of overexpression of GnT-III on E-cadherin retained and E-cadherin·catenin complex formation. A, indicated cells treated with or without TGF-β1 for 4 days were harvested and lysed for immunoblotting (IB). Equal amounts of protein (20 μg) were separated on 7.5% SDS-PAGE under reducing conditions, and the membranes were probed with antibody against E-cadherin and reprobed with anti-α-tubulin, which was used as loading control. B, ratios of E-cadherin retained after treatment with TGF-β1. The ratio of intensity of E-cadherin treated with TGF-β versus intensity of E-cadherin treated without TGF-β1 of control cells, as shown in A was set as 1. The quantitative data were obtained from three independent experiments. The p value was calculated using Student's two-tailed t test. Error bars indicate S.D. C, cell surface biotinylation was performed as described under “Experimental Procedures.” Equal amounts of the cell lysates were immunoprecipitated (IP) with avidin-agarose. The immunoprecipitates were subjected to 7.5% SDS-PAGE. The membranes were probed with anti-E-cadherin, β-catenin, and α-catenin antibodies for immunoblot analysis. D, time course for cell surface biotinylation in cells treated with TGF-β for 0, 2, 4, and 6 days. The relative intensity was a ratio of E-cadherin versus α-tubulin. The quantitative data were obtained from three independent experiments. E, after metabolic labeling with [35S]methionine and -cysteine for 30 min, cells were then chased at the indicated times. The cells were lysed, and the same amounts of cell lysate were immunoprecipitated with anti-E-cadherin antibody at the indicated times. F, relative intensity was a ratio of band intensity at each chasing point versus the band intensity at 0 time, which was 100%. The data were obtained form two independent experiments. G, cell lysates from indicated cells were immunoprecipitated using anti-E-cadherin antibody. Immunoprecipitates were run on a 7.5% SDS-polyacrylamide gel and probed with the biotinylated E4-PHA and L4-PHA lectins and anti-E-cadherin antibody.
FIGURE 5.
FIGURE 5.
Localization of β-catenin in GnT-III-expressing cells after treatment with TGF-β1. A, to visualize the effects of overexpression of GnT-III on the localization of β-catenin, control and GnT-III-expressing cells were cultured with or without TGF-β as described above and then stained with anti-β-catenin primary antibody, phalloidin, or TO-PRO-3 and fluorescent secondary antibodies. Arrows indicate β-catenin expressed on cell-cell adhesion junctions. Arrowheads indicate localization of β-catenin in nuclei. Scale bar, 50 μm. B, nuclear proteins were prepared as described under “Experimental Procedures.” The membrane plus cytoplasm or nuclear fractions of these indicated cells were probed with anti-β-catenin or anti-phospho-Smad2 antibody. α-Tubulin was used as a load control. The ratios of nuclear β-catenin versus membrane and cytoplasmic β-catenin or nuclear p-Smad2 versus α-tubulin are shown as folds, in which the ratio for control cells without TGF-β1 treatment was set as 1. C, cell lysates from indicated cells were immunoblotted (IB) with anti-pY-β-catenin (upper panel) and anti-β-catenin antibody (middle panel). The relative intensities showed ratios of pY-β-catenin versus β-catenin (lower panel). The quantitative data were obtained from three independent experiments. The p value was calculated using Student's two-tailed t test. Error bars indicate S.D. D, equal amounts of the cell lysates (20 μg) were immunoprecipitated (IP) with anti-β-catenin antibody. The immunoprecipitates were subjected to 7.5% SDS-PAGE, and the membranes were probed with anti-phospho-Smad2 (upper panel) or anti-β-catenin (middle panel) antibody. The relative intensities showed ratios of p-Smad2 versus β-catenin (lower panel). The quantitative data were obtained from three independent experiments. The p value was calculated using Student's two-tailed t test. Error bars indicate S.D.
FIGURE 6.
FIGURE 6.
Effects of overexpression of GnT-III on FN-mediated migration induced by TGF-β1. Cell migration toward FN was determined using the transwell assay as described under “Experimental Procedures.” Cells that migrated were stained with 0.5% crystal violet. A, representative example. Scale bar, 100 μm. B, migrated cells were counted under a microscope. The quantitative data were obtained from three independent experiments. The p value was calculated using Student's two-tailed t test. Error bars indicate S.D.
FIGURE 7.
FIGURE 7.
Schematic representation of a model for the regulation of GnT-III expression and its function in EMT and cell-cell adhesion. It was previously reported that GnT-III expression and bisected N-glycans were up-regulated by cell-cell adhesion in an E-cadherin-catenin-dependent manner (20, 21) and down-regulated by Wnt/β-catenin signaling (22). The intersection point for the reciprocal regulation of GnT-III is at the β-catenin, which is a central player in both cadherin-mediated cell adhesion and canonical Wnt signaling. In this study, the expression of GnT-III was down-regulated during EMT induced by TGF-β1. Conversely, overexpression of GnT-III promoted cell-cell adhesion, and inhibited β-catenin·p-Smad complex formation, EMT, and cell migration induced by TGF-β1. Therefore, GnT-III could be an important mediator for those intracellular signal networks. This study further suggests that the bisecting GlcNAc, a unique structure, plays an important role in cell biological functions during normal development, EMT, and cancer metastasis. →, up-regulation; ⊥, down-regulation.

Similar articles

Cited by

References

    1. Huber M. A., Kraut N., Beug H. (2005) Molecular requirements for epithelial-mesenchymal transition during tumor progression. Curr. Opin. Cell Biol. 17, 548–558 - PubMed
    1. Kalluri R., Weinberg R. A. (2009) The basics of epithelial-mesenchymal transition. J. Clin. Invest. 119, 1420–1428 - PMC - PubMed
    1. Thiery J. P., Sleeman J. P. (2006) Complex networks orchestrate epithelial-mesenchymal transitions. Nat. Rev. Mol. Cell Biol. 7, 131–142 - PubMed
    1. Prall F. (2007) Tumor budding in colorectal carcinoma. Histopathology 50, 151–162 - PubMed
    1. Brabletz T., Jung A., Reu S., Porzner M., Hlubek F., Kunz-Schughart L. A., Knuechel R., Kirchner T. (2001) Variable β-catenin expression in colorectal cancers indicates tumor progression driven by the tumor environment. Proc. Natl. Acad. Sci. U.S.A. 98, 10356–10361 - PMC - PubMed

Publication types

MeSH terms

Substances

LinkOut - more resources