. 2012 Mar 25;15(5):793-802.
doi: 10.1038/nn.3078.

A toolbox of Cre-dependent optogenetic transgenic mice for light-induced activation and silencing

Affiliations

A toolbox of Cre-dependent optogenetic transgenic mice for light-induced activation and silencing

Linda Madisen et al. Nat Neurosci. .

Abstract

Cell type-specific expression of optogenetic molecules allows temporally precise manipulation of targeted neuronal activity. Here we present a toolbox of four knock-in mouse lines engineered for strong, Cre-dependent expression of channelrhodopsins ChR2-tdTomato and ChR2-EYFP, halorhodopsin eNpHR3.0 and archaerhodopsin Arch-ER2. All four transgenes mediated Cre-dependent, robust activation or silencing of cortical pyramidal neurons in vitro and in vivo upon light stimulation, with ChR2-EYFP and Arch-ER2 demonstrating light sensitivity approaching that of in utero or virally transduced neurons. We further show specific photoactivation of parvalbumin-positive interneurons in behaving ChR2-EYFP reporter mice. The robust, consistent and inducible nature of our ChR2 mice represents a significant advance over previous lines, and the Arch-ER2 and eNpHR3.0 mice are to our knowledge the first demonstration of successful conditional transgenic optogenetic silencing. When combined with the hundreds of available Cre driver lines, this optimized toolbox of reporter mice will enable widespread investigations of neural circuit function with unprecedented reliability and accuracy.


Figures
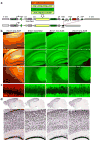
Figure 1
Figure 1
Generation and expression characterization of the Ai27, Ai32, Ai35 and Ai39 Cre-reporter lines. (a) Gene targeting vectors were designed to insert the Cre-dependent reporter cassettes into intron 2 of the Rosa26 locus. After obtaining germline-transmitted F1 mice, the PGK-neo selection cassette can be deleted by PhiC31-mediated recombination between the AttB and AttP sites, which combine into an AttL site, by breeding with a Rosa26-PhiC31 deleter line. (b) tdTomato, EYFP, and EGFP native fluorescence in Emx1-Cre;Ai27, Emx1-Cre;Ai32, Emx1-Cre;Ai35 and Emx1-Cre;Ai39 mice. Scale bar, 200 μm. (c) Confocal images of the CA1 pyramidal neurons in the same mice as in b, showing the cell membrane localization of tdTomato, EYFP and EGFP fluorescence. Scale bar, 20 μm. (d) Reporter gene mRNA expression in Emx1-Cre;Ai27, Emx1-Cre;Ai32, Emx1-Cre;Ai35 and Emx1-Cre;Ai39 mice (ages all ~P56), using in situ hybridization (Ai27, tdTomato riboprobe; Ai32, Ai35 and Ai39, EGFP/EYFP riboprobe). Scale bar, 200 μm.
Figure 2
Figure 2
Photostimulation of pyramidal neurons in cortical slices of Emx1-Cre;Ai27 (abbreviated as E-Ai27), Emx1-Cre;Ai32 (E-Ai32), and Ai32 alone (-Cre) mice. (a) A barrel cortex slice with the 8 × 16 photostimulation grid overlaid (blue dots; spacing 50 μm). Scale bar, 200 μm. (b) Schematic of the photostimulation geometry and example traces. Whole-cell voltage-clamp traces from the dashed box area (left) are shown for E-Ai27 (with 840 μW light), E-Ai32 (70 μW) and Ai32 (1490 μW). Triangles, soma locations. (c) Waveforms of APs evoked by photoactivating the somata and dendrites (magenta) and axons (black). The arrow marks the inflection point. (d) Whole-cell current-clamp traces showing evoked APs in the 8 × 16 grid for a typical cell each of E-Ai27 (1700 μW), E-Ai32 (155 μW), Ai32 (1500 μW), and IUE (155 μW). (e) Minimum laser power required to evoke an AP from at least one stimulation site. (f) Number of photostimulation sites evoking an AP as a function of laser power in E-Ai32 neurons (n = 7). (g) Number of stimulation sites triggering APs using high laser powers. (h) Spike latencies of somatic/dendritic APs from the light onset. E-Ai32h: E-Ai32 cells (n = 9 cells, 143 APs) under high powers (≥1 mW). E-Ai32l: E-Ai32 cells (n = 9 cells, 28 APs) under low powers (≤100 μW). E-Ai27: E-Ai27 cells (n = 2 cells, 4 APs) under high powers. Spike latencies of axonal APs (not shown) varied greatly. (i) Number of stimulation sites triggering APs using low laser powers.
Figure 3
Figure 3
Effective silencing of cortical pyramidal neurons by Arch-ER2 in Emx1-Cre;Ai35 (E-Ai35) and eNpHR3.0 in Emx1-Cre;Ai39 (E-Ai39) mice. (a) Biocytin staining (red) of a cortical pyramidal neuron after recording. Scale bar, 100 μm. (b) Voltage responses of representative neurons to a 1-s negative current injection or a 1-s light pulse. Under both conditions, Cell 2 from E-Ai35 and E-Ai39 exhibits rebound firing at the end of the stimulus, whereas Cell 1 does not. (c) Voltage response of a neuron to 10 consecutive trials of laser stimulation (1-s pulse, 1-s interpulse interval). Values are normalized to the first trial; first trial ΔV was -27.05 ± 2.38 mV (n = 8, E-Ai35) or -19.43 ± 2.82 mV (n = 10, E-Ai39). (d) Average hyperpolarization from the resting membrane potential (mean of 10 stimulations as in c) evoked by different light intensities. (e) Representative photocurrent traces under voltage clamp (-70 mV) and 12 mW mm-2 illumination. (f) Mean photocurrents evoked by low and high light intensity. (g) Effective suppression of AP firing in E-Ai35 or E-Ai39 neurons evoked by positive current injection (+50-100 pA). (h) Voltage responses of Ai35 (-Cre) and E-Ai35 neurons under maximal light illumination (23 mW mm-2). (i) Comparison of light-induced hyperpolarization in Cre-positive (E-Ai35, n = 15; E-Ai39, n = 14) and Cre-negative (Ai35, n = 4; Ai39, n = 7) neurons. (j) Maximum light (23 mW mm-2) failed to slow or silence the firing of a Cre-negative Ai35 neuron evoked by positive current injection (+100 pA).
Figure 4
Figure 4
Alternative light sources for silencing of cortical pyramidal neurons in Emx1-Cre;Ai35 (E-Ai35) and Emx1-Cre;Ai39 (E-Ai39) mice. (a-c) Inhibition of E-Ai35 neurons by a white LED. (a) An example E-Ai35 neuron exhibited similar hyperpolarization response to negative current injection (-100 pA) and illumination by white light. (b) White light dose-response curve (n = 3). (c) An example of effective silencing by white light (11 mW mm-2) of APs evoked by a positive current injection (+100 pA). (d-f) Inhibition of E-Ai35 neurons by red laser light (640 nm). (d) An example E-Ai35 neuron exhibited similar hyperpolarization response to negative current injection (-100 pA) and illumination by red light. (e) Red light dose-response curve (n = 7). At the highest tested intensity (25 mW mm-2) the 640-nm laser illumination achieved 43% ± 5% of the hyperpolarization achieved with the 593-nm laser. (f) An example of silencing of current-evoked APs by red laser light. (g-h) Inhibition of E-Ai39 neurons by a white LED. (g) White light dose-response curve (n = 5). (h) An example of silencing of current-evoked APs by white light. (i-j) Inhibition of E-Ai39 neurons by red laser light (640 nm). (i) Red light dose-response curve (n = 7). At the highest tested intensity (25 mW mm-2) the 640-nm laser illumination achieved 100% ± 35% of the hyperpolarization achieved with the 593-nm laser. (j) An example of silencing of current-evoked APs by red laser light.
Figure 5
Figure 5
Effective silencing of induced population bursting in the hippocampal circuit in Emx1-Cre;Ai35 mice. (a) Schematic for the inhibition of presynaptic neurons in the hippocampal circuit. K+ (8 mM) induced population bursting in CA1 was recorded with an extracellular electrode (R). A white light source (LED, yellow circle) was positioned over CA3 to activate Arch-ER2 in presynaptic neurons. (b) Representative traces of the integrated (top) and raw (bottom) population bursting activity from CA1 before (expanded traces in inset 1), during (2), and following (3) the illumination of CA3. Raw population bursting activity is the direct measure of unit activity. Integrated population activity represents the change of unit activity (time constant = 200 ms). (c) Quantified response of population bursting from CA1 (n = 4 experiments) during 4 intervals: light-off control; the first (0) and final (4) minute of a 5-min exposure to white light; and 5 minutes after light exposure (recovery). Values were normalized to light-off control (** p < 0.01, repeated measures ANOVA; mean ± s.e.m.). (d) Schematic for the inhibition of postsynaptic neurons in the hippocampal circuit. Neurons were recorded simultaneously using dual extracellular electrodes (CA1: R, CA3: R1). A white LED was positioned over CA1 to activate Arch-ER2 in postsynaptic neurons. (e) Representative traces of the integrated (top) and raw (bottom) population bursting activity from CA3 and CA1 before (inset 1), during (2), and following (3) illumination to CA1. Light to CA1 led to suppressed bursting from that region, but bursting activity in CA3 was unaffected.
Figure 6
Figure 6
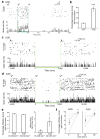
Optical activation or silencing of pyramidal neuron activities in the neocortex of awake Emx1-Cre;Ai27, Emx1-Cre;Ai32, Emx1-Cre;Ai35 and Camk2a-CreERT2;Ai39 mice (abbreviated as Ai27, Ai32, Ai35 or Ai39, respectively, here). (a) Neural activity and spike waveforms in a representative Ai32 neuron before, during and after 200-ms blue light illumination (3 mW mm-2). Top, spike raster plot; bottom, histogram of instantaneous firing rate averaged across trials (bin size, 5 ms). (b) Average changes in firing rates upon blue light illumination in Ai27 and Ai32 mice. (*** p < 0.001) (c) Neural activity and spike waveforms in a representative Ai35 neuron before, during and after 5-s green light illumination (13 mW mm-2). (d) Neural activity and spike waveforms in a representative Ai39 neuron before, during and after 5-s green light illumination (30 mW mm-2). For c and d, top, spike raster plot; bottom, histogram of instantaneous firing rate averaged across trials (bin size, 10 ms). (e) Average changes in firing rates (left) and latencies (right) observed in Ai35 and Ai39 single units during green light illumination at indicated light intensities. (* p < 0.05) (f) Green light illumination at higher intensity induced more powerful silencing in Ai35 and Ai39 mice. (* p < 0.05, ** p<0.01) All data points are mean ± s.e.m.
Figure 7
Figure 7
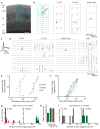
In vivo identification of light-activated neurons in the hippocampus and thalamus of Pvalb-IRES-Cre;Ai32 mice. (a) Excitation of ChR2-expressing neurons in the hippocampal CA1 region during waking state. Top row shows peristimulus histogram of a Pvalb+ neuron (Cell 47) transiently activated by single pulses or 8-Hz sinus light stimulation (1 mW). Also shown are the autocorrelogram (ACG) and waveform (± s.e.) of the neuron. Note typical ACG for a fast firing putative basket cell . Bottom row shows the same arrangement for a nearby pyramidal cell (Cell 45). Note ACG typical of bursting neurons. (b) Optogenetic (left) and physiological (right) classifications of neuron types in the hippocampus strongly overlap. Physiological segregation of simultaneously recorded neurons is based on two parameters – spike width and trough-to-peak time (inset). (c) Activation of ChR2-expressing neurons in the thalamus during anesthesia. Top row shows a reticular nucleus Pvalb+ neuron (Cell 4-16) in response to single pulses or 10-Hz sinus light stimulation. Bottom row shows a simultaneously recorded thalamocortical neuron (Cell 2-23) with typical bursting pattern in ACG , . (d) Distribution of burst index in the activated (putative reticular, red) and suppressed (putative thalamocortical, blue) neurons. Burst index is the ratio of spikes with short (<6 ms) inter-spike intervals relative to other spikes in the same session. (e) Light-evoked cortical patterns in response to reticular nucleus stimulation in the waking Pvalb-IRES-Cre;Ai32 mice. Single pulse (left) and sinus pattern (10 Hz, right) evoked activities are epidural recordings from the ipsilateral and contralateral parietal areas.

Similar articles

Cited by

References

    1. Boyden ES, Zhang F, Bamberg E, Nagel G, Deisseroth K. Millisecond-timescale, genetically targeted optical control of neural activity. Nat Neurosci. 2005;8:1263–1268. - PubMed
    1. Li X, et al. Fast noninvasive activation and inhibition of neural and network activity by vertebrate rhodopsin and green algae channelrhodopsin. Proc Natl Acad Sci USA. 2005;102:17816–17821. - PMC - PubMed
    1. Nagel G, et al. Channelrhodopsin-2, a directly light-gated cation-selective membrane channel. Proc Natl Acad Sci USA. 2003;100:13940–13945. - PMC - PubMed
    1. Han X, Boyden ES. Multiple-color optical activation, silencing, and desynchronization of neural activity, with single-spike temporal resolution. PLoS ONE. 2007;2:e299. - PMC - PubMed
    1. Zhang F, Aravanis AM, Adamantidis A, de Lecea L, Deisseroth K. Circuit-breakers: optical technologies for probing neural signals and systems. Nat Rev Neurosci. 2007;8:577–581. - PubMed

Publication types

MeSH terms