. 2012 Aug;11(8):272-85.
doi: 10.1074/mcp.M111.016568. Epub 2012 Mar 22.

Absolute quantitation of isoforms of post-translationally modified proteins in transgenic organism

Affiliations

Absolute quantitation of isoforms of post-translationally modified proteins in transgenic organism

Yaojun Li et al. Mol Cell Proteomics. 2012 Aug.

Abstract

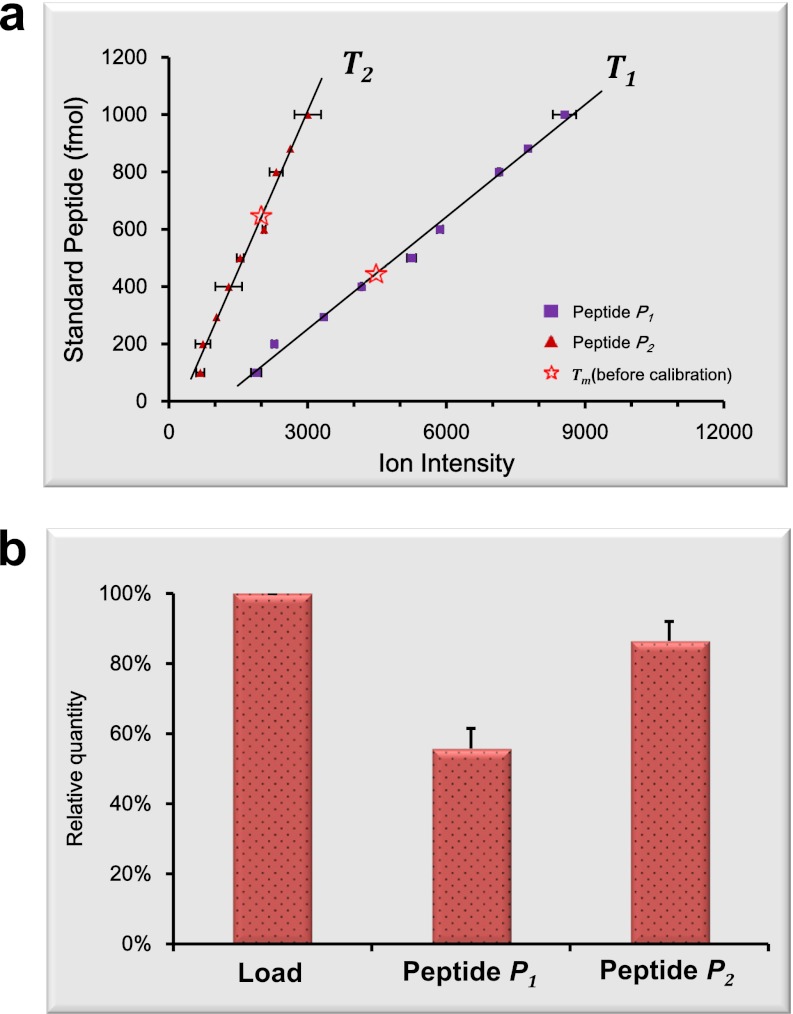
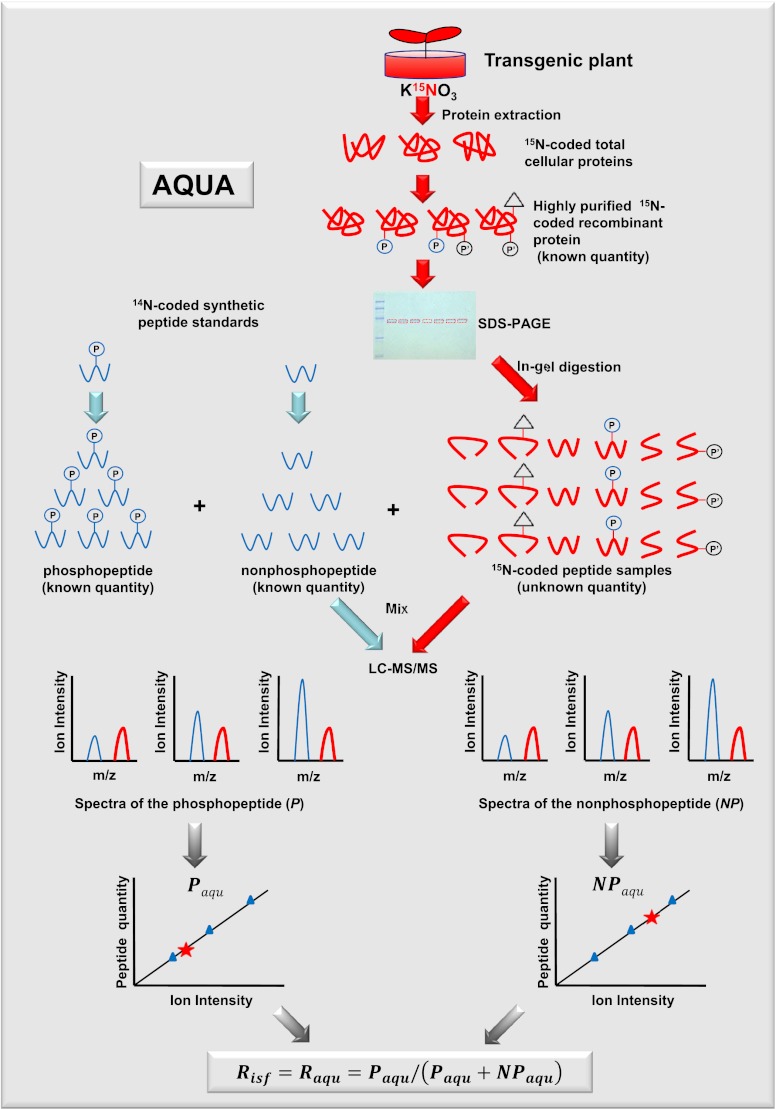
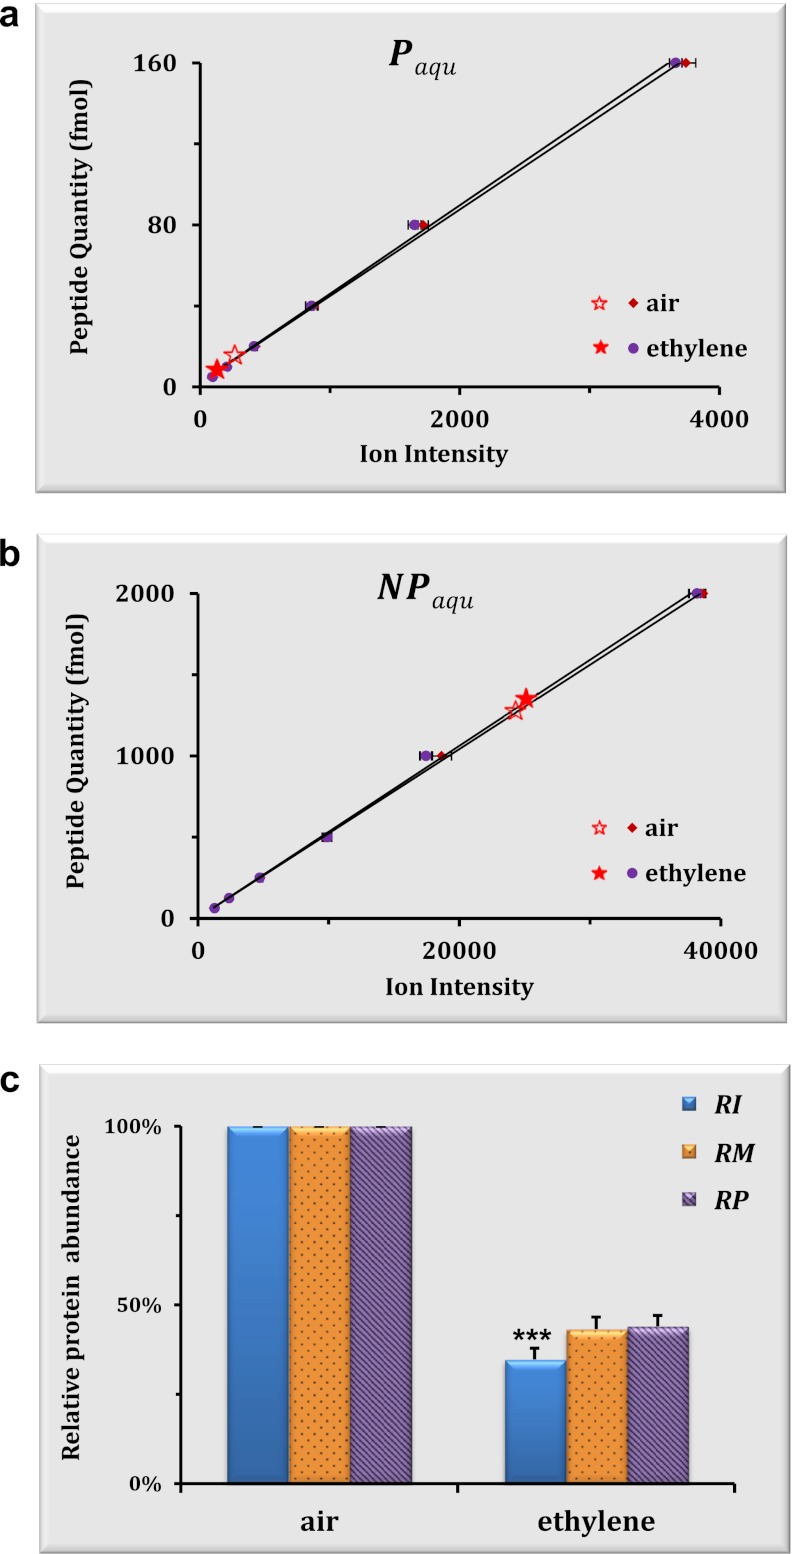
Post-translational modification isoforms of a protein are known to play versatile biological functions in diverse cellular processes. To measure the molar amount of each post-translational modification isoform (P(isf)) of a target protein present in the total protein extract using mass spectrometry, a quantitative proteomic protocol, absolute quantitation of isoforms of post-translationally modified proteins (AQUIP), was developed. A recombinant ERF110 gene overexpression transgenic Arabidopsis plant was used as the model organism for demonstration of the proof of concept. Both Ser-62-independent (14)N-coded synthetic peptide standards and (15)N-coded ERF110 protein standard isolated from the heavy nitrogen-labeled transgenic plants were employed simultaneously to determine the concentration of all isoforms (T(isf)) of ERF110 in the whole plant cell lysate, whereas a pair of Ser-62-dependent synthetic peptide standards were used to quantitate the Ser-62 phosphosite occupancy (R(aqu)). The P(isf) was finally determined by integrating the two empirically measured variables using the following equation: P(isf) = T(isf) · R(aqu). The absolute amount of Ser-62-phosphorylated isoform of ERF110 determined using AQUIP was substantiated with a stable isotope labeling in Arabidopsis-based relative and accurate quantitative proteomic approach. The biological role of the Ser-62-phosphorylated isoform was demonstrated in transgenic plants.


Figures

Fig. 1.
Fig. 1.
An AQUIP strategy for measurement of the molar amount of recombinant proteins from the whole cell lysate. Transgenic Arabidopsis overexpressing a recombinant gene of interest, such as ERF110, was labeled with the stable isotope 15N via SILIA protocol (top panel). The 15N-coded crude total cellular proteins were divided into two parts. One part was first subjected to TAP, whereas the other was resolved on SDS-PAGE gel together with the TAP-purified recombinant protein (right middle panel). The highly purified recombinant ERF110 protein serves as an internal control to measure the peptide yield from tryptic digestion and enrichment of ERF110 present in the total cellular protein as suggested by PSAQ strategy (right middle panel). After determination of the mass amount of purified ERF110, 12 ng (294 fmol) and 36 ng (882 fmol) of 15N-coded recombinant ERF110 proteins were subjected to SDS-PAGE gel, followed by in-gel trypsin digestion and peptide extraction (right middle panel). To absolute quantitate (AQUA) the 15N-coded tryptic peptides derived from a target protein using the 14N-coded synthetic peptide standards, two oligopeptides, SPAPGEPPFIK227 (P1) and GWLGIDSAPIPSSFAR59 (P2) were synthesized and used to establish standard curves (bottom panel). The 15N-coded total cellular proteins (0.7 mg) from the whole cell lysate of ERF110-ox/ein2-5 Arabidopsis (air-treated for 12 h) were loaded into seven lanes of SDS-PAGE gel, each with an equal amount. The 15N-coded peptide sample mixture was generated from in-gel trypsin digestion of a fraction of total cellular proteins with a molecular size of ∼40 kDa (left middle panel). A series of peptide standards (100, 200, 400, 500, 600, 800, and 1000 fmol) were then spiked into the seven 15N-coded peptide samples, followed by LC-MS/MS analysis (bottom panel). A standard curve was then established according to the correlation between the molar amount and the ion intensity of each 14N-coded peptide standard on MS.
Fig. 2.
Fig. 2.
Absolute quantitation of recombinant ERF110 protein in cell lysate. a, the molar amount of a standard peptide is correlated to its ion intensity: T1 = 0. 1307T1-ion −140.64 (r2 = 0.9934) for peptide P1 and T2 = 0.3703T2-ion − 101.28 (r2 = 0.9866) for peptide P2. The open red stars in a indicate the Tm value calculated according to the ion intensity Tm-ion from whole isotopic envelope of precursor ion of the peptide Pm. b, the average peptide yield (km) of peptide Pm is presented in the percentage of the loading amount of the pure recombinant protein standard. Here, the m value is 1 or 2. The amino acid sequences of peptide P1 and P2 are SPAPGEPPFIK227 and GWLGIDSAPIPSSFAR50, respectively.
Fig. 3.
Fig. 3.
An AQUA strategy for relative quantitation of Ser-62-phosphorylated isoform over all isoforms of recombinant ERF110 proteins. A known quantity (12 pmol) of 15N-coded recombinant ERF110 proteins, including both Ser-62-phosphorylated isoform (circled P) and all of its cognates of different types of PTMs (circled P′ or triangle), were highly purified from ERF110-ox/ein2-5 Arabidopsis (either air- or ethylene-treated for 12 h), divided into six aliquots, and resolved on SDS-PAGE gel, followed by in-gel trypsin digestion. The 14N-coded synthetic Ser-62-phosphopeptide and its nonphosphorylated cognate were mixed together with concentrations 5, 10, 20, 40, 80, or 160 fmol and 62.5, 125, 250, 500, 1000, or 2000 fmol, respectively. Then the 14N-coded peptide standard pairs were spiked into six aliquots of 15N-coded peptide samples. After the oxidization of methionine residues on the peptides and LC-MS/MS analysis, two standard curves were built by this AQUA method between the ion intensity of whole isotopic envelopes of standard peptide P and NP. The amino acid sequence of Ser-62 phosphosite-containing oligopeptide is VDS62SHNPIEESMSK73. The molar amounts of Ser-62-phosphorylated peptide (Paqu) and its nonphosphorylated cognate (NPaqu), both of which were derived from the highly purified and 15N-coded ERF110 protein isoforms, were determined according to the two standard curves, respectively. The percentage of Ser-62-phosphrylated ERF110 isoform among all of ERF110 isoforms in the total cellular proteins is defined as the site-specific phosphorylation occupancy Risf, which is equivalent to Ser-62 phosphosite occupancy Raqu in the peptide sample and determined using AQUA method. The error values indicate standard deviations.
Fig. 4.
Fig. 4.
Determination and substantiation of Ser-62-phosphorylated ERF110 isoform concentration via AQUIP and relative quantitation. a and b, standard curves constructed for the absolute quantitation of the molar amount of Ser-62-phosphopeptide (Paqu) and its nonphosphorylated cognate (NPaqu) from the peptide sample derived from the highly purified recombinant ERF110 proteins. The standard curves for measuring the Ser-62 phosphosite peptides, Paqu and NPaqu value, from air-treated ERF110-ox/ein2-5 Arabidopsis are Paqu = 0.0427Pion + 2.1545 (r2 = 0.9984), and NPaqu = 0.0516Pion + 12.224 (r2 = 0.9996), respectively, whereas the standard curves for measuring Ser-62 phosphosite peptides from the ethylene-treated protein sample are Paqu = 0.0437Pion + 2.3165 (r2 = 0.9977) and NPaqu = 0.0526Pion + 11.564 (r2 = 0.9976), respectively. Paqu and NPaqu values of ERF110 proteins in both air- and ethylene-treated total cellular protein samples are labeled with open and solid stars on the standard curves, respectively. c, relative measurement of both Ser-62-phosphorylated ERF110 isoform and Ser-62-phosphopeptide from both air- and ethylene-treated (12 h) ERF110-ox/ein2-5 Arabidopsis. The ratio of ion intensity (RI) of the whole isotopic envelopes of 14N-coded over 15N-coded phosphopeptides derived from both air- and ethylene-treated (12 h) ERF110-ox/ein2-5 Arabidopsis (RI = Pion-ethylene/Pion-air where Pion = (Pion + NPion) × Rion, Equation S14 in supplemental Fig. 1b). The mass ratio (RM) of the 14N/15N-coded ERF110 phosphoprotein in between air- and ethylene-treated total cellular protein samples is determined using a standard curve log2RM = 0.8226·log2RI − 0.0355, r2 = 0.995 (supplemental Fig. 4d). The molar ratio (RP) of Ser-62-phosphorylated ERF110 isoform (Pisf) between air- and ethylene-treated protein samples is determined according to a ratio of Pisf-ethylene/Pisf-air, where Pisf = Tisf·Risf (or Raqu) and Raqu = Paqu/(Paqu + NPaqu). p (t test): 5.2 × 10⁻⁹ (RI versus RM), 2.4 × 10⁻¹⁰ (RI versus RP). ***, t test significance p < 0.001.
Fig. 5.
Fig. 5.
The role for Ser-62 phosphorylation of ERF110 protein in Arabidopsis growth and development. a, both rosette leaf and inflorescence number of flowering Arabidopsis are indicated at the y axis, respectively. An ethylene-insensitive genetic mutant ein2-5 was used as the nontransgenic control plant. The statistical significance p (t test) between rosette leaf numbers of ERF110-ox/ein2-5 and ein2-5 is 2.4 × 10⁻⁹, whereas the statistical significance p (t test) between ERF110-ox/ein2-5 and ERF110S62A-ox/ein2-5 is 1.4 × 10⁻⁶. Similarly, p (t test) of an inflorescence number between ERF110-ox/ein2-5 and ein2-5 is 2.9 × 10⁻⁸, whereas p (t test) of an inflorescence number between ERF110-ox/ein2-5 and ERF110S62A-ox/ein2-5 is 0.003. The numbers of the ein2-5, ERF110-ox/ein2-5, and ERF110S62A-ox/ein2-5 Arabidopsis for this statistical analysis are 31, 60, and 20, respectively. b, photograph of ERF110 transgenic and nontransgenic ethylene response mutant plants. Monoclonal anti-biotin antibody is used to detect the expression of recombinant ERF110 protein during Western blot analysis of transgenic plants (as shown under the photograph). S62A stands for a mutant ERF110 carrying a single point mutation at Ser-62 position from serine to alanine. Bar, 5 cm. * and ***, t test significance p < 0.05 and p < 0.001, respectively.

Similar articles

Cited by

References

    1. Mann M., Jensen O. N. (2003) Proteomic analysis of post-translational modifications. Nat. Biotechnol. 21, 255–261 - PubMed
    1. Witze E. S., Old W. M., Resing K. A., Ahn N. G. (2007) Mapping protein post-translational modifications with mass spectrometry. Nat. Methods 4, 798–806 - PubMed
    1. Krishna R. G., Wold F. (1993) Post-translational modification of proteins. Adv. Enzymol. Relat. Areas Mol. Biol. 67, 265–298 - PubMed
    1. Cohen P. (2002) The origins of protein phosphorylation. Nat. Cell Biol. 4, E127–E130 - PubMed
    1. Yoo S. D., Cho Y. H., Tena G., Xiong Y., Sheen J. (2008) Dual control of nuclear EIN3 by bifurcate MAPK cascades in C2H4 signalling. Nature 451, 789–795 - PMC - PubMed

Publication types

MeSH terms

LinkOut - more resources