Enzymatic targeting of the stroma ablates physical barriers to treatment of pancreatic ductal adenocarcinoma
- PMID: 22439937
- PMCID: PMC3371414
- DOI: 10.1016/j.ccr.2012.01.007
Enzymatic targeting of the stroma ablates physical barriers to treatment of pancreatic ductal adenocarcinoma
Abstract
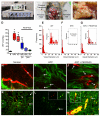
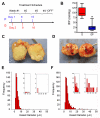
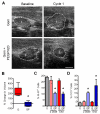
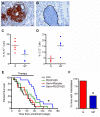
Pancreatic ductal adenocarcinomas (PDAs) are characterized by a robust fibroinflammatory response. We show here that this desmoplastic reaction generates inordinately high interstitial fluid pressures (IFPs), exceeding those previously measured or theorized for solid tumors, and induces vascular collapse, while presenting substantial barriers to perfusion, diffusion, and convection of small molecule therapeutics. We identify hyaluronan, or hyaluronic acid (HA), as the primary matrix determinant of these barriers and show that systemic administration of an enzymatic agent can ablate stromal HA from autochthonous murine PDA, normalize IFP, and re-expand the microvasculature. In combination with the standard chemotherapeutic, gemcitabine, the treatment permanently remodels the tumor microenvironment and consistently achieves objective tumor responses, resulting in a near doubling of overall survival.
Copyright © 2012 Elsevier Inc. All rights reserved.
Figures


Comment in
-
Targeting tumor architecture to favor drug penetration: a new weapon to combat chemoresistance in pancreatic cancer?Cancer Cell. 2012 Mar 20;21(3):327-9. doi: 10.1016/j.ccr.2012.03.002. Cancer Cell. 2012. PMID: 22439929
-
Compression of pancreatic tumor blood vessels by hyaluronan is caused by solid stress and not interstitial fluid pressure.Cancer Cell. 2014 Jul 14;26(1):14-5. doi: 10.1016/j.ccr.2014.06.003. Cancer Cell. 2014. PMID: 25026209 Free PMC article. No abstract available.
-
Response to Chauhan et Al.: interstitial pressure and vascular collapse in pancreas cancer-fluids and solids, measurement and meaning.Cancer Cell. 2014 Jul 14;26(1):16-7. doi: 10.1016/j.ccr.2014.06.004. Cancer Cell. 2014. PMID: 25026210 Free PMC article. No abstract available.
Similar articles
-
Hyaluronan impairs vascular function and drug delivery in a mouse model of pancreatic cancer.Gut. 2013 Jan;62(1):112-20. doi: 10.1136/gutjnl-2012-302529. Epub 2012 Mar 30. Gut. 2013. PMID: 22466618 Free PMC article.
-
HALO 202: Randomized Phase II Study of PEGPH20 Plus Nab-Paclitaxel/Gemcitabine Versus Nab-Paclitaxel/Gemcitabine in Patients With Untreated, Metastatic Pancreatic Ductal Adenocarcinoma.J Clin Oncol. 2018 Feb 1;36(4):359-366. doi: 10.1200/JCO.2017.74.9564. Epub 2017 Dec 12. J Clin Oncol. 2018. PMID: 29232172 Clinical Trial.
-
Signal Transducer and Activator of Transcription 3, Mediated Remodeling of the Tumor Microenvironment Results in Enhanced Tumor Drug Delivery in a Mouse Model of Pancreatic Cancer.Gastroenterology. 2015 Dec;149(7):1932-1943.e9. doi: 10.1053/j.gastro.2015.07.058. Epub 2015 Aug 7. Gastroenterology. 2015. PMID: 26255562 Free PMC article.
-
Targeting the Tumor Stroma: the Biology and Clinical Development of Pegylated Recombinant Human Hyaluronidase (PEGPH20).Curr Oncol Rep. 2017 Jul;19(7):47. doi: 10.1007/s11912-017-0608-3. Curr Oncol Rep. 2017. PMID: 28589527 Review.
-
Do anti-stroma therapies improve extrinsic resistance to increase the efficacy of gemcitabine in pancreatic cancer?Cell Mol Life Sci. 2018 Mar;75(6):1001-1012. doi: 10.1007/s00018-017-2678-7. Epub 2017 Oct 9. Cell Mol Life Sci. 2018. PMID: 28993833 Free PMC article. Review.
Cited by
-
The distribution of liver cancer stem cells correlates with the mechanical heterogeneity of liver cancer tissue.Histochem Cell Biol. 2021 Jul;156(1):47-58. doi: 10.1007/s00418-021-01979-w. Epub 2021 Mar 12. Histochem Cell Biol. 2021. PMID: 33710418
-
Genetically engineered mouse models of pancreatic cancer.Cancer J. 2012 Nov-Dec;18(6):502-10. doi: 10.1097/PPO.0b013e31827ab4c4. Cancer J. 2012. PMID: 23187836 Free PMC article. Review.
-
Intratumoral electroporation of a self-amplifying RNA expressing IL-12 induces antitumor effects in mouse models of cancer.Mol Ther Nucleic Acids. 2022 Jul 20;29:387-399. doi: 10.1016/j.omtn.2022.07.020. eCollection 2022 Sep 13. Mol Ther Nucleic Acids. 2022. PMID: 36035753 Free PMC article.
-
Distribution of Gemcitabine Is Nearly Homogenous in Two Orthotopic Murine Models of Pancreatic Cancer.Cancer Biother Radiopharm. 2015 Sep;30(7):299-304. doi: 10.1089/cbr.2015.1869. Epub 2015 Jul 23. Cancer Biother Radiopharm. 2015. PMID: 26203552 Free PMC article.
-
Gut microbiota and its therapeutic implications in tumor microenvironment interactions.Front Microbiol. 2024 Jan 23;15:1287077. doi: 10.3389/fmicb.2024.1287077. eCollection 2024. Front Microbiol. 2024. PMID: 38322318 Free PMC article. Review.
References
-
- Allison DC, Piantadosi S, Hruban RH, Dooley WC, Fishman EK, Yeo CJ, Lillemoe KD, Pitt HA, Lin P, Cameron JL. DNA content and other factors associated with ten-year survival after resection of pancreatic carcinoma. J Surg Oncol. 1998;67:151–159. - PubMed
-
- Balazs EA, Denlinger JL. Clinical uses of hyaluronan. Ciba Foundation symposium. 1989;143:265–275. discussion 275-280, 281-265. - PubMed
-
- Boucher Y, Jain RK. Microvascular pressure is the principal driving force for interstitial hypertension in solid tumors: implications for vascular collapse. Cancer Res. 1992;52:5110–5114. - PubMed
-
- Boucher Y, Kirkwood JM, Opacic D, Desantis M, Jain RK. Interstitial hypertension in superficial metastatic melanomas in humans. Cancer research. 1991;51:6691–6694. - PubMed
Publication types
MeSH terms
Substances
Grants and funding
- R01 CA129357/CA/NCI NIH HHS/United States
- R21 CA152249/CA/NCI NIH HHS/United States
- K08 CA114028/CA/NCI NIH HHS/United States
- CA114028/CA/NCI NIH HHS/United States
- P30 DK056465/DK/NIDDK NIH HHS/United States
- P01 CA109552/CA/NCI NIH HHS/United States
- CA161112/CA/NCI NIH HHS/United States
- R01 CA161112/CA/NCI NIH HHS/United States
- R01 CA161112-01/CA/NCI NIH HHS/United States
- CA152249/CA/NCI NIH HHS/United States
- R21 CA152249-02/CA/NCI NIH HHS/United States
- P01 CA109552-05/CA/NCI NIH HHS/United States
- CA109552/CA/NCI NIH HHS/United States
- K08 CA114028-03/CA/NCI NIH HHS/United States
LinkOut - more resources
Full Text Sources
Other Literature Sources
Medical
Molecular Biology Databases

