. 2012 May 3;119(18):4192-204.
doi: 10.1182/blood-2011-11-389585. Epub 2012 Mar 21.

Galectin-9 binding to Tim-3 renders activated human CD4+ T cells less susceptible to HIV-1 infection

Affiliations

Galectin-9 binding to Tim-3 renders activated human CD4+ T cells less susceptible to HIV-1 infection

Shokrollah Elahi et al. Blood. .

Abstract

Galectin-9 (Gal-9) is a tandem repeat-type member of the galectin family and is a ligand for T-cell immunoglobulin mucin domain 3 (Tim-3), a type-I glycoprotein that is persistently expressed on dysfunctional T cells during chronic infection. Studies in autoimmune diseases and chronic viral infections show that Tim-3 is a regulatory molecule that inhibits Th1 type immune responses. Here we show that soluble Gal-9 interacts with Tim-3 expressed on the surface of activated CD4(+) T cells and renders them less susceptible to HIV-1 infection and replication. The Gal-9/Tim-3 interaction on activated CD4(+) T cells, leads to down-regulation of HIV-1 coreceptors and up-regulation of the cyclin-dependent kinase inhibitor p21 (also known as cip-1 and waf-1). We suggest that higher expression of Tim-3 during chronic infection has evolved to limit persistent immune activation and associated tissue damage. These data demonstrate a novel mechanism for Gal-9/Tim-3 interactions to induce resistance of activated CD4(+) T cells to HIV-1 infection and suggest that Gal-9 may play a role in HIV-1 pathogenesis and could be used as a novel microbicide to prevent HIV-1 infection.


Figures
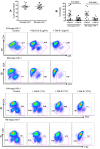
Figure 1
Figure 1
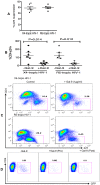
Reduced susceptibility of CD4+ T cells to HIV-1 infection in the presence of Gal-9. (A) Percentages of p24 suppression in activated CD4+ T cells stimulated with Gal-9 (1 μg/mL) 2 hours before HIV-1 infection with X4-tropic (HIV-1LAI) and R-5 (HIV-1JR-CSF) isolates. CD4+ T cells from 12 HIV-1 seronegative (filled symbols) and 4 HIV-1 seropositive (open symbols) were studied. (B) Percentages of CD4+p24+ cells in activated CD4+ T cells in the presence of Gal-9 (1 μg/mL) 2 hours before HIV-1 infection with X4-tropic (HIV-1LAI) and R-5 (HIV-1JR-CSF) isolates. Significance was tested using paired t test. (C-D) Representative flow cytometry dot plots from CD4+ T cells stimulated with 0.5 μg/mL or 1 μg/mL Gal-9 before infection with X4-tropic or R5-tropic HIV-1 isolates, respectively. (E-F) Representative flow cytometry dot plots from CD4+ T cells stimulated with Gal-9 (1 μg/mL) for 1, 2, and 12 hours before infection with X4-tropic or R5-tropic HIV-1 isolates, respectively. The number of infected cells was quantified by intracellular viral p24 antigen staining using flow cytometry on day 5 after infection. Error bars indicate mean ± SEM from duplicate cell cultures from 12 HIV-1 seronegative and 4 HIV+ individuals infected 4 separate times with both X4-and R5-tropic viral isolates in vitro. Each point represents an individual.
Figure 2
Figure 2
Gal-9 down-regulates CCR5, CXCR4 and α4β7 on the surface of activated CD4+ T cells. (A) Percentage of CCR5 suppression in PHA activated CD4+ T cells after stimulation with Gal-9 (1 μg/mL) for 2 and 12 hours. Data obtained from 8 HIV-1 seronegative individuals. (B) Percentage of CXCR4 suppression in IL-4/dexamethasone activated CD4+ T cells after stimulation with Gal-9 (1 μg/mL) for 2 and 12 hours. Data obtained from 4 HIV-1 seronegative individuals. (C) Percentage of α4β7 suppression in retinoic acid activated CD4+ T cells after stimulation with Gal-9 (1 μg/mL) for 2 and 12 hours. Data obtained from 9 HIV-1 seronegative individuals. Significance was tested using paired t test. (D-F) Representative flow cytometry dot plots from CD4+ T cells in the absence of Gal-9 (−Gal-9; left flow panel) or in the presence of Gal-9 (+Gal-9; right flow panel) for CCR5, CXCR4, and α4β7, respectively. Data obtained 2 hours after stimulation with Gal-9. Error bars indicate mean ± SEM from duplicate cell cultures from 4 to 9 independent experiments performed in vitro. Each point represents an individual.
Figure 3
Figure 3
Gal-9 reduces HIV-1 infection in CD4+ T cells that are already HIV-infected. (A) Percentages of p24 suppression in activated CD4+ T cells that were exposed to Gal-9 (1 μg/mL) for 2 hours after HIV-1 infection with X-4 and R-5-tropic isolates. (B) Percentages of CD4+p24+ cells in activated CD4+ T cells in the presence of Gal-9 (1 μg/mL) 2 hours after HIV-1 infection with X-4-tropic (HIV-1LAI) and R-5 (HIV-1JR-CSF) isolates. Significance was tested using paired t test. (C) Representative flow cytometry dot plots from CD4+ T cells infected, and then stimulated with 1 μg/mL Gal-9 after infection with X-4-tropic or R5-tropic HIV-1 isolates, respectively. (D) Representative flow cytometry dot plots from CD4+ T cells incubated for 2 hours with 0.5 μg/mL Gal-9 prior or after infection with GFP-labeled T-cell tropic single-cycle HIV-1SF2. CD4+ T cells from 6 HIV-1 seronegative donors were used for each viral isolate. The number of infected cells was quantified by intracellular GFP detection 40 hours after infection for SF2 isolate and viral p24 antigen staining using flow cytometry on day 5 after infection for other viral isolates. Data are from 6 HIV-1 seronegative individuals infected with both X4-and R5-tropic viral isolates in vitro with duplicate cultures per condition. Error bars indicate mean ± SEM from duplicate cell cultures from 6 HIV-1 seronegative individuals infected 4 separate times with both X4-and R5-tropic viral isolates in vitro. Each point represents an individual.
Figure 4
Figure 4
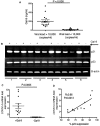
Elevation of Gal-9 in plasma of HIV+ individuals and up-regulation of p21 in CD4+ T cells after stimulation with Gal-9. (A) Detected levels of plasma Gal-9 from 30 HIV+ individuals with a viral load of less or more than 10 000 copies/mL. (B) RT-PCR reflecting β-actin, p53, and p21 gene expression in activated CD4+ T cells stimulated with Gal-9 (1 μg/mL; +Gal-9) or in the absence of Gal-9 (−Gal-9) for 2 hours before total RNA isolation. (C) Quantitative CDKN1A mRNA fold expression from activated CD4+ T cells after stimulation with Gal-9 (1 μg/mL) for 2 hours in vitro compared with CDKN1A mRNA expression in CD4+ T cells in the absence of Gal-9 from the same individual. Significance was tested using Wilcoxon signed rank test. (D) Correlation between CDKN1A mRNA fold expression from CD4+ T cells in the presence of Gal-9 (1 μg/mL) and resistance to HIV-1 infection. Resistance to infection was measured by intracellular staining for viral p24 antigen using flow cytometry on CD4+ T cells infected with R5-tropic HIV-1 isolate in the presence of Gal-9 (1 μg/mL). Pearson correlation coefficient is shown. Data were obtained from 12 different individuals and each point represents 1 individual.
Figure 5
Figure 5
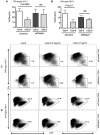
Gal-9–mediated up-regulation of p21 reduces the susceptibility of CD4+ T cells to HIV-1 infection. (A) Percentages of CD4+p24+ cells in activated CD4+ T cells in the presence of control or p21-specific siRNA; then stimulated with Gal-9 (1 μg/mL) 2 hours before HIV-1 infection with R-5-tropic (HIV-1JR-CSF) or (B) X-4 tropic (HIV-1LAI) isolate. (C) Representative example of dot plots from activated CD4+ T cells infected in the presence of p21-specific or control siRNA with R5-tropic HIV-1 isolate or (D) X4-tropic HIV-1 isolate in the presence (0.5 μg/mL or 1 μg/mL) or absence of Gal-9. Viral infection was measured by viral p24 antigen staining on CD4+ T cells using flow cytometry. Plots are representative of independent experiments performed on 3 different donors for each viral isolate. Significance was tested using paired t test.
Figure 6
Figure 6
Gal-9 reduces infection of CD4+ T cells to HIV-1 infection and up-regulates p21 through interaction with Tim-3. (A) Representative dot plots of activated CD4+ T cells in the presence of Gal-9 (1 μg/mL) for 2 hours and also in the presence or absence of anti–Tim-3 antibodies (2.5, 5, and 7.5 μg/mL anti–Tim-3 antibody [clone F38-2E2]) before in vitro infection with X4-Tropic isolate. Data obtained by flow cytometry 5 days after infection. (B) RT-PCR reflecting GAPDH and p21 gene expression in activated CD4+ T cells in the absence of Gal-9 (−), presence of Gal-9 (+), and presence of both anti–Tim-3 antibody and Gal-9 (++). SNO2, SN06, and SN011 are 3 HIV-1 seronegative individuals. These data are representative of 3 independent experiments performed on 3 different individuals.
Figure 7
Figure 7
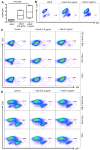
Gal-9 enhances HIV-1 infection of resting CD4+ T cells. (A) Percentages of CD4+p24+ in nonactivated CD4+ T cells in the absence or presence of Gal-9 (0.5 μg/mL or 1 μg/mL) 2 hours before HIV-1 infection with X-4-tropic (HIV-1LAI) isolates. Bounds of boxes denote interquartile range; lines within boxes denote median; and whiskers indicate range. Significance was tested using Kruskal-Wallis test. (B) Representative flow cytometry dot plots from CD4+ T cells stimulated with 0.5 μg/mL or 1 μg/mL Gal-9 before infection with X-4-tropic HIV-1 isolate in vitro. (C) Rested CD4+ T cells were incubated with bacitracin (+Bac), or anti-PDI mAb RL77 (1:3000 D) or in the absence of both (−PDI mAb or Bac). Then Gal-9 (0.5 μg/mL or 1 μg/mL) as indicated was added for 2 hours and cells were washed. Five days after infection, the number of infected cells with X4-tropic HIV-1 isolate was quantified by intracellular viral p24 antigen staining using flow cytometry. (D) PHA activated CD4+ T cells were incubated with bacitracin (+Bac), anti-PDI mAb RL77 (1:3000 D), or in the absence of both (−PDI mAb or Bac). Then Gal-9 (0.5 μg/mL or 1 μg/mL) as indicated was added for 2 hours and cells were washed. Five days after infection, the number of infected cells with X4-tropic HIV-1 isolate was quantified by intracellular viral p24 antigen staining using flow cytometry.

Similar articles

Cited by

References

    1. Fauci AS, Johnston MI, Dieffenbach CW, et al. HIV vaccine research: the way forward. Science. 2008;321(5888):530–532. - PubMed
    1. Haase AT. Targeting early infection to prevent HIV-1 mucosal transmission. Nature. 2010;464(7286):217–223. - PubMed
    1. Rerks-Ngarm S, Pitisuttithum P, Nitayaphan S, et al. Vaccination with ALVAC and AIDSVAX to prevent HIV-1 infection in Thailand. N Engl J Med. 2009;361(23):2209–2220. - PubMed
    1. Liu R, Paxton WA, Choe S, et al. Homozygous defect in HIV-1 coreceptor accounts for resistance of some multiply-exposed individuals to HIV-1 infection. Cell. 1996;86(3):367–377. - PubMed
    1. Chen H, Li C, Huang J, et al. CD4+ T cells from elite controllers resist HIV-1 infection by selective up-regulation of p21. J Clin Invest. 2011;121(4):1549–1560. - PMC - PubMed

Publication types

MeSH terms