Mechanism of strand displacement synthesis by DNA replicative polymerases
- PMID: 22434889
- PMCID: PMC3401438
- DOI: 10.1093/nar/gks253
Mechanism of strand displacement synthesis by DNA replicative polymerases
Abstract
Replicative holoenzymes exhibit rapid and processive primer extension DNA synthesis, but inefficient strand displacement DNA synthesis. We investigated the bacteriophage T4 and T7 holoenzymes primer extension activity and strand displacement activity on a DNA hairpin substrate manipulated by a magnetic trap. Holoenzyme primer extension activity is moderately hindered by the applied force. In contrast, the strand displacement activity is strongly stimulated by the applied force; DNA polymerization is favoured at high force, while a processive exonuclease activity is triggered at low force. We propose that the DNA fork upstream of the holoenzyme generates a regression pressure which inhibits the polymerization-driven forward motion of the holoenzyme. The inhibition is generated by the distortion of the template strand within the polymerization active site thereby shifting the equilibrium to a DNA-protein exonuclease conformation. We conclude that stalling of the holoenzyme induced by the fork regression pressure is the basis for the inefficient strand displacement synthesis characteristic of replicative polymerases. The resulting processive exonuclease activity may be relevant in replisome disassembly to reset a stalled replication fork to a symmetrical situation. Our findings offer interesting applications for single-molecule DNA sequencing.
Figures


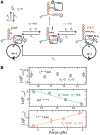
 (light green), mean degradation rate
  (orange) and mean strand displacement rate
  (purple) measured for the wt T4 holoenzyme shown as a function of the applied force. Error bars are the s.e.m. The number of molecules and enzymatic traces analysed varies between Nmol = 9–27 and N = 75–253, respectively, depending on the condition.
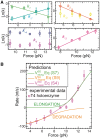
 ,
,  ,
,  and
and  shown as a function of the applied force. Errors are estimated from the single- or double-exponential fits.


Comment on
- Nucleic Acids Res.
Similar articles
-
Collaborative coupling between polymerase and helicase for leading-strand synthesis.Nucleic Acids Res. 2012 Jul;40(13):6187-98. doi: 10.1093/nar/gks254. Epub 2012 Mar 20. Nucleic Acids Res. 2012. PMID: 22434886 Free PMC article.
-
Simultaneous formation of functional leading and lagging strand holoenzyme complexes on a small, defined DNA substrate.Proc Natl Acad Sci U S A. 1998 Sep 15;95(19):11128-33. doi: 10.1073/pnas.95.19.11128. Proc Natl Acad Sci U S A. 1998. PMID: 9736701 Free PMC article.
-
Insights into Okazaki fragment synthesis by the T4 replisome: the fate of lagging-strand holoenzyme components and their influence on Okazaki fragment size.J Biol Chem. 2013 Jul 19;288(29):20807-20816. doi: 10.1074/jbc.M113.485961. Epub 2013 May 31. J Biol Chem. 2013. PMID: 23729670 Free PMC article.
-
Replisome structure suggests mechanism for continuous fork progression and post-replication repair.DNA Repair (Amst). 2019 Sep;81:102658. doi: 10.1016/j.dnarep.2019.102658. Epub 2019 Jul 8. DNA Repair (Amst). 2019. PMID: 31303546 Free PMC article. Review.
-
Coordinated DNA Replication by the Bacteriophage T4 Replisome.Viruses. 2015 Jun 19;7(6):3186-200. doi: 10.3390/v7062766. Viruses. 2015. PMID: 26102578 Free PMC article. Review.
Cited by
-
Conformational Dynamics of DNA Polymerases Revealed at the Single-Molecule Level.Front Mol Biosci. 2022 Feb 25;9:826593. doi: 10.3389/fmolb.2022.826593. eCollection 2022. Front Mol Biosci. 2022. PMID: 35281261 Free PMC article. Review.
-
Single-Molecule Insights Into the Dynamics of Replicative Helicases.Front Mol Biosci. 2021 Aug 26;8:741718. doi: 10.3389/fmolb.2021.741718. eCollection 2021. Front Mol Biosci. 2021. PMID: 34513934 Free PMC article. Review.
-
DNA Helicase-Polymerase Coupling in Bacteriophage DNA Replication.Viruses. 2021 Aug 31;13(9):1739. doi: 10.3390/v13091739. Viruses. 2021. PMID: 34578319 Free PMC article. Review.
-
DNA Polymerase-Parental DNA Interaction Is Essential for Helicase-Polymerase Coupling during Bacteriophage T7 DNA Replication.Int J Mol Sci. 2022 Jan 25;23(3):1342. doi: 10.3390/ijms23031342. Int J Mol Sci. 2022. PMID: 35163266 Free PMC article.
-
Sulfolobus chromatin proteins modulate strand displacement by DNA polymerase B1.Nucleic Acids Res. 2013 Sep;41(17):8182-95. doi: 10.1093/nar/gkt588. Epub 2013 Jul 1. Nucleic Acids Res. 2013. PMID: 23821667 Free PMC article.
References
-
- Sherman LA, Gefter ML. Studies on the mechanism of enzymatic DNA elongation by Escherichia coli DNA polymerase II. J. Mol. Biol. 1976;103:61–76. - PubMed
-
- LaDuca RJ, Fay PJ, Chuang C, McHenry CS, Bambara RA. Site-specific pausing of deoxyribonucleic acid synthesis catalyzed by four forms of Escherichia coli DNA polymerase III. Biochemistry. 1983;22:5177–5188. - PubMed
-
- Weaver DT, DePamphilis ML. The role of palindromic and non-palindromic sequences in arresting DNA synthesis in vitro and in vivo. J. Mol. Biol. 1984;180:961–986. - PubMed
-
- Hacker KJ, Alberts BM. The rapid dissociation of the T4 DNA polymerase holoenzyme when stopped by a DNA hairpin helix. A model for polymerase release following the termination of each Okazaki fragment. J. Biol. Chem. 1994;269:24221–24228. - PubMed
-
- Benkovic SJ, Valentine AM, Salinas F. Replisome-mediated DNA replication. Ann. Rev. Biochem. 2001;70:181–208. - PubMed
Publication types
MeSH terms
Substances
Grants and funding
LinkOut - more resources
Full Text Sources
Other Literature Sources

