

A cell-based small molecule screening method for identifying inhibitors of epithelial-mesenchymal transition in carcinoma
- PMID: 22432005
- PMCID: PMC3303807
- DOI: 10.1371/journal.pone.0033183
A cell-based small molecule screening method for identifying inhibitors of epithelial-mesenchymal transition in carcinoma
Abstract
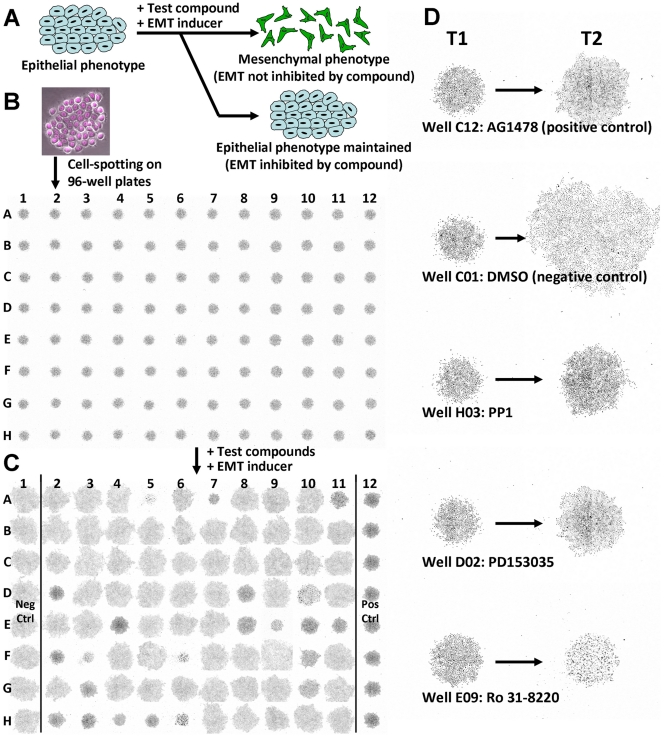
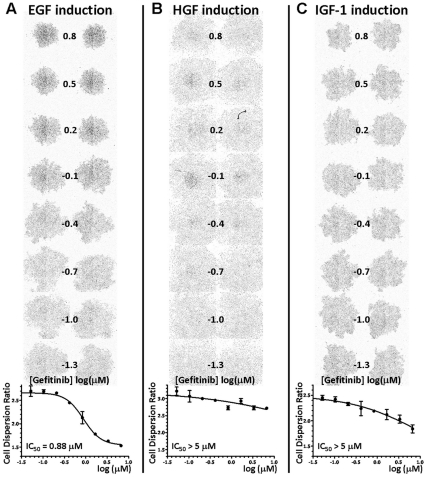
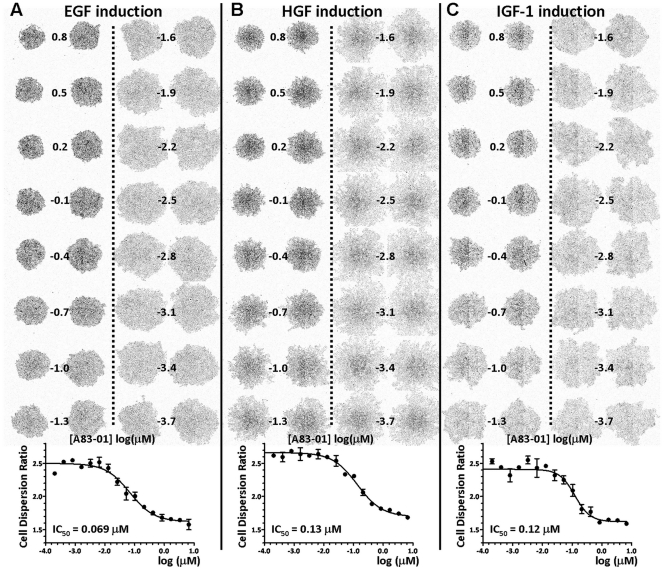
Epithelial Mesenchymal Transition (EMT) is a crucial mechanism for carcinoma progression, as it provides routes for in situ carcinoma cells to dissociate and become motile, leading to localized invasion and metastatic spread. Targeting EMT therefore represents an important therapeutic strategy for cancer treatment. The discovery of oncogene addiction in sustaining tumor growth has led to the rapid development of targeted therapeutics. Whilst initially optimized as anti-proliferative agents, it is likely that some of these compounds may inhibit EMT initiation or sustenance, since EMT is also modulated by similar signaling pathways that these compounds were designed to target. We have developed a novel screening assay that can lead to the identification of compounds that can inhibit EMT initiated by growth factor signaling. This assay is designed as a high-content screening assay where both cell growth and cell migration can be analyzed simultaneously via time-course imaging in multi-well plates. Using this assay, we have validated several compounds as viable EMT inhibitors. In particular, we have identified compounds targeting ALK5, MEK, and SRC as potent inhibitors that can interfere with EGF, HGF, and IGF-1 induced EMT signaling. Overall, this EMT screening method provides a foundation for improving the therapeutic value of recently developed compounds in advanced stage carcinoma.
Conflict of interest statement
Figures

Similar articles
-
Sorafenib inhibits the hepatocyte growth factor-mediated epithelial mesenchymal transition in hepatocellular carcinoma.Mol Cancer Ther. 2011 Jan;10(1):169-77. doi: 10.1158/1535-7163.MCT-10-0544. Mol Cancer Ther. 2011. PMID: 21220499
-
Proteomic analysis of ovarian cancer cells during epithelial-mesenchymal transition (EMT) induced by epidermal growth factor (EGF) reveals mechanisms of cell cycle control.J Proteomics. 2017 Jan 16;151:2-11. doi: 10.1016/j.jprot.2016.06.009. Epub 2016 Jul 6. J Proteomics. 2017. PMID: 27394697
-
Aphthous ulcer drug inhibits prostate tumor metastasis by targeting IKKɛ/TBK1/NF-κB signaling.Theranostics. 2018 Sep 9;8(17):4633-4648. doi: 10.7150/thno.26687. eCollection 2018. Theranostics. 2018. PMID: 30279728 Free PMC article.
-
Small molecule inhibitors of epithelial-mesenchymal transition for the treatment of cancer and fibrosis.Med Res Rev. 2020 Jan;40(1):54-78. doi: 10.1002/med.21596. Epub 2019 May 27. Med Res Rev. 2020. PMID: 31131921 Review.
-
Molecular signature and therapeutic perspective of the epithelial-to-mesenchymal transitions in epithelial cancers.Drug Resist Updat. 2008 Aug-Oct;11(4-5):123-51. doi: 10.1016/j.drup.2008.07.001. Epub 2008 Aug 20. Drug Resist Updat. 2008. PMID: 18718806 Review.
Cited by
-
Functional relevance of a six mesenchymal gene signature in epithelial-mesenchymal transition (EMT) reversal by the triple angiokinase inhibitor, nintedanib (BIBF1120).Oncotarget. 2015 Sep 8;6(26):22098-113. doi: 10.18632/oncotarget.4300. Oncotarget. 2015. PMID: 26061747 Free PMC article.
-
Actin cytoskeleton self-organization in single epithelial cells and fibroblasts under isotropic confinement.J Cell Sci. 2019 Mar 7;132(5):jcs220780. doi: 10.1242/jcs.220780. J Cell Sci. 2019. PMID: 30787030 Free PMC article.
-
Secondary Metabolites from the Culture of the Marine-derived Fungus Paradendryphiella salina PC 362H and Evaluation of the Anticancer Activity of Its Metabolite Hyalodendrin.Mar Drugs. 2020 Apr 3;18(4):191. doi: 10.3390/md18040191. Mar Drugs. 2020. PMID: 32260204 Free PMC article.
-
Targeting codon 158 p53-mutant cancers via the induction of p53 acetylation.Nat Commun. 2020 Apr 29;11(1):2086. doi: 10.1038/s41467-020-15608-y. Nat Commun. 2020. PMID: 32350249 Free PMC article.
-
New insights into the role of EMT in tumor immune escape.Mol Oncol. 2017 Jul;11(7):824-846. doi: 10.1002/1878-0261.12093. Epub 2017 Jun 27. Mol Oncol. 2017. PMID: 28614624 Free PMC article. Review.
References
-
- Reese DE, Mikawa T, Bader DM. Development of the coronary vessel system. Circ Res. 2002;91:761–768. - PubMed
-
- Thiery JP. Epithelial-mesenchymal transitions in tumour progression. Nat Rev Cancer. 2002;2:442–454. - PubMed
-
- Husemann Y, Geigl JB, Schubert F, Musiani P, Meyer M, et al. Systemic spread is an early step in breast cancer. Cancer Cell. 2008;13:58–68. - PubMed
Publication types
MeSH terms
Substances
LinkOut - more resources
Full Text Sources
Other Literature Sources
Miscellaneous
