. 2012 May;32(10):1867-78.
doi: 10.1128/MCB.06712-11. Epub 2012 Mar 19.

Shp2 controls female body weight and energy balance by integrating leptin and estrogen signals

Affiliations

Shp2 controls female body weight and energy balance by integrating leptin and estrogen signals

Zhao He et al. Mol Cell Biol. 2012 May.

Abstract

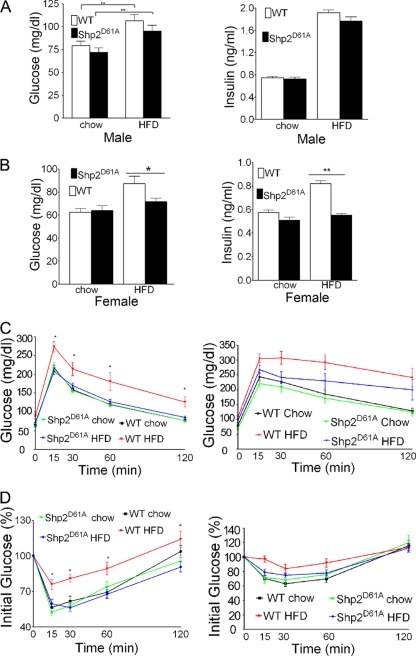
In mammals, leptin regulates food intake and energy balance mainly through the activation of LepRb in the hypothalamus, and estrogen has a leptin-like effect in the hypothalamic control of metabolism. However, it remains to be elucidated how estrogen signaling is intertwined with the leptin pathway. We show here that Shp2, a nonreceptor tyrosine phosphatase, acts to integrate leptin and estrogen signals. The expression of a dominant-active mutant (Shp2(D61A)) in forebrain neurons conferred female, but not male, transgenic mice resistance to high-fat diet (HFD)-induced obesity and liver steatosis, accompanied by improved insulin sensitivity and glucose homeostasis. Fed with either HFD or regular chow food, Shp2(D61A) female mice showed dramatically enhanced leptin sensitivity. Microinjection of Shp2(D61A)-expressing adeno-associated virus into mediobasal hypothalamus elicited a similar antiobese effect in female mice. Biochemical analyses showed a physical association of Shp2 with estrogen receptor alpha, which is necessary for the synergistic and persistent activation of Erk by leptin and estrogen. Together, these results elucidate a mechanism for the direct cross talk of leptin and estrogen signaling and offer one explanation for the propensity of postmenopausal women to develop obesity.


Figures

Fig 1
Fig 1
Shp2D61A expression confers resistance to HFD-induced obesity in female mice. (A and B) The expression of Shp2D61A in the hypothalamus area of transgenic mice was examined by anti-HA and anti-Shp2 immunoblotting (A) and immunostaining (B). Similar levels of HA-tagged Shp2D61A were detected in the brains of male and female mice. D61A: Shp2D61A. Scale bar, 50 μm. (C) Representatives of wt or transgenic female and male mice that were fed on HFD or chow diet for 20 weeks. (D) Body weights of wt versus Shp2D61A mice on either HFD or chow diet. The data are expressed as means ± the SEM (n = 10 to 15; *, P < 0.05; **, P < 0.01; ***, P < 0.001). (E) Female mice at the ages of 10 to 12 weeks were ovariectomized. After 1 week, the mice were fed on either HFD or regular chow food. The body weights were monitored biweekly. The percentages of weight gain are shown. The data are expressed as means ± the SEM (n = 4 to 6; *, P < 0.05; **, P < 0.01). (F and G) Index of gonadal fat pad to body weight. The ratios of brown adipose tissue or liver to body weight were compared between control and transgenic male or female mice on chow diet or HFD. The data are expressed as means ± the SEM (n = 11 to 15; *, P < 0.05; ***, P < 0.001). (H) Representative image of adipocyte sizes on HFD, with H&E staining. Scale bar, 100 μm.
Fig 2
Fig 2
Shp2D61A expression suppresses liver steatosis. (A and B) Liver steatosis of male mice shown using Oil Red and H&E staining, respectively. (C and D) Fatty livers of female mice are shown using Oil Red and H&E staining, respectively. (E and F) Hepatic lipid accumulation was quantified for male and female mice on chow or HFD. Scale bar, 50 μm. (n = 3 to 5; *, P < 0.05; **, P < 0.01). D61A, Shp2D61A.
Fig 3
Fig 3
Shp2D61A female mice displayed reduced food intake and increased energy expenditure. (A) The daily food intake of mice on HFD. The data are expressed as means ± the SEM. *, P < 0.05. (B) Heat production was measured for wt and Shp2D61A female mice on HFD. The data are expressed as means ± the SEM. (C) O2 consumption and CO2 production of wt versus Shp2D61A female mice on HFD. Total O2 consumption and CO2 production data were shown without normalization. (D to F) O2 consumption and CO2 production of wt versus Shp2D61A female mice on HFD. The data normalized by the whole body weight are expressed as means ± the SEM. *, P < 0.05.
Fig 4
Fig 4
Shp2D61A expression improves metabolic parameters. (A) Serum insulin and blood glucose levels were compared between Shp2D61A and wt male mice, fed HFD or chow diet. The data are expressed as the means ± the standard deviation (SD). (B) Blood glucose and serum insulin levels were measured for control and transgenic female mice on HFD compared to chow diet. The data are expressed as means ± the SD. (C) GTT in wt versus Shp2D61A mice on HFD or chow diet. The data are expressed as means ± the SD. Left panel, female mice; right panel, male mice. (D) ITT in wt versus Shp2D61A mice on HFD or chow diet. The data are expressed as means ± the SD. Left panel, female; right panel, male mice. (n = 11 to 15, *, P < 0.05; **, P < 0.01).
Fig 5
Fig 5
Expression of Shp2D61A increases leptin sensitivity. After mice were fed a HFD or a chow diet for 20 weeks, the serum leptin levels were measured. (A) Serum leptin levels were compared between wt and Shp2D61A male mice on a HFD or chow diet. (B) Serum leptin amounts were compared between wt and Shp2D61A female mice on a HFD or chow diet. (C) Leptin was injected intraperitoneally twice daily for 3 days. The body weights of female mice were measured daily for 7 days. The data are expressed as means ± the SD. *, P < 0.05; **, P < 0.01; ***, P < 0.001. (D) Leptin was injected intraperitoneally twice daily for 3 days. Body weight of male mice was measured daily for 7 days. The data are expressed as means ± the SD. (E) Immunoblotting analysis was performed to evaluate serum levels of adiponectin after 20 weeks on HFD. The lower panel gives the relative intensities of the adiponectin bands in the immunoblot. (F to H) Serum levels of estrogen, testosterone, and corticosterone measured after 20 weeks on a HFD.
Fig 6
Fig 6
Shp2 couples leptin and estrogen signaling in hypothalamus. (A) Shp2, ERα, and pY-STAT3 signals were detected by immunostaining with specific antibodies in the hypothalamus area after leptin injection. Scale bar, 50 μm. (B and C) Brain (B) and uterus (C) tissues were used to perform coimmunoprecipitation assay with specific antibodies to Shp2 and ERα. (D) MCF-7 cell lysate was prepared for coimmunoprecipitation with specific antibodies to ERα or Shp2 and subjected to immunoblotting as shown. Immunofluorescent staining for Shp2 and ERα in MCF-7 cells. (E) In vitro translation system using estradiol-17β (E2) enhanced binding of Shp2 and ERα in vitro. (F) E2-induced association of Shp2 with ERα in MCF-7 cells.
Fig 7
Fig 7
Shp2 enhances leptin and estrogen signals. (A) Leptin and E2 induced phosphorylation of Erk1/2, Src, Stat3, and Akt in PC12LepRb cells. The right panel shows p-Erk quantification (n = 3). (B) Leptin and E2 stimulated phosphorylation of Erk1/2, Akt, and Stat3 in the brains of Shp2D61A mice. The right panel shows p-Erk quantification (n = 4 to 5). (C) Knockdown of Shp2 or ERα inhibited p-Erk1/2 induction by leptin or estrogen. Cells incubated in medium with 1 to 2% serum were treated with either or both of the two hormones. The right panel shows p-Erk quantification (n = 3). (D) Cells starved in serum-free medium were treated with leptin and/or estrogen for the induction of p-Erk1/2 signals.
Fig 8
Fig 8
Hypothalamic injection of AAV-Shp2D61A prevents HFD-induced obesity by inhibiting food intake and increasing energy expenditure. C57BL/6 mice (chow-fed, ∼3 months old) with matched sex and body weight were randomized and bilaterally injected with AAV-Shp2D61A or the control AAV-GFP into the mediobasal hypothalamus. After viral injection, the mice were maintained on chow feeding for 3 to 4 weeks and then switched to HFD feeding. (A) Brain sections across the mediobasal hypothalamus were prepared from AAV-GFP injected mice, and the GFP distribution in hypothalamus sections was examined by GFP immunostaining. DAPI (4′,6′-diamidino-2-phenylindole) staining revealed the nuclei of all cells in the sections. 3V, third ventricle. Scale bar, 50 μm. (B) Body weights of AAV-Shp2D61A-injected female mice versus AAV-GFP-injected female mice. (C) Body weight gains of AAV-Shp2D61A-injected mice versus AAV-GFP-injected mice on HFD. The data are expressed as means ± the SD. *, P < 0.05. (D) Average daily HFD intake of AAV-Shp2D61A-injected mice versus AAV-GFP-injected mice. The data are expressed as means ± the SD. *, P < 0.05. (E) Fat and lean masses of AAV-Shp2D61A-injected mice versus AAV-GFP-injected female mice. (F) Fat percentages of AAV-Shp2D61A-injected female mice versus AAV-GFP-injected female mice with HFD. The data are expressed as means ± the SD. *, P < 0.05. (G and H) O2 consumption and CO2 production of AAV-Shp2D61A-injected female mice versus AAV-GFP-injected female mice on HFD. O2 consumption and CO2 production data were normalized by lean mass of mice. The data are expressed as means ± the SD. *, P < 0.05. (I) GTT in AVV-Shp2D61A-injected female mice versus AAV-GFP-injected female mice on HFD. The data are expressed as means ± the SD. *, P < 0.05.
Fig 9
Fig 9
Model for concerted leptin and estrogen signaling in hypothalamic regulation of energy balance. (A) Young women and girls have normal levels of leptin and estrogen that act in concert in the hypothalamus to regulate energy metabolism. (B) Even with normal leptin levels, postmenopausal women have increased risk for development of obesity and leptin resistance, due to estrogen deficiency. (C) Obese young women with normal estrogen production may develop obesity due to leptin resistance. (D) Obese postmenopausal women have defects in leptin and estrogen signaling due to leptin resistance and estrogen deficiency.

Similar articles

Cited by

References

    1. Al-Qassab H, et al. 2009. Dominant role of the p110β isoform of PI3K over p110α in energy homeostasis regulation by POMC and AgRP neurons. Cell Metab. 10:343–354 - PMC - PubMed
    1. Banno R, et al. 2010. PTP1B and SHP2 in POMC neurons reciprocally regulate energy balance in mice. J. Clin. Invest. 120:720–734 - PMC - PubMed
    1. Barash IA, et al. 1996. Leptin is a metabolic signal to the reproductive system. Endocrinology 137:3144–3147 - PubMed
    1. Bard-Chapeau EA, et al. 2011. Ptpn11/Shp2 acts as a tumor suppressor in hepatocellular carcinogenesis. Cancer Cell 19:629–639 - PMC - PubMed
    1. Bjorbaek C, et al. 2001. Divergent roles of SHP-2 in ERK activation by leptin receptors. J. Biol. Chem. 276:4747–4755 - PubMed

Publication types

MeSH terms