

Detecting patches of protein sites of influenza A viruses under positive selection
- PMID: 22427709
- PMCID: PMC3408068
- DOI: 10.1093/molbev/mss095
Detecting patches of protein sites of influenza A viruses under positive selection
Abstract
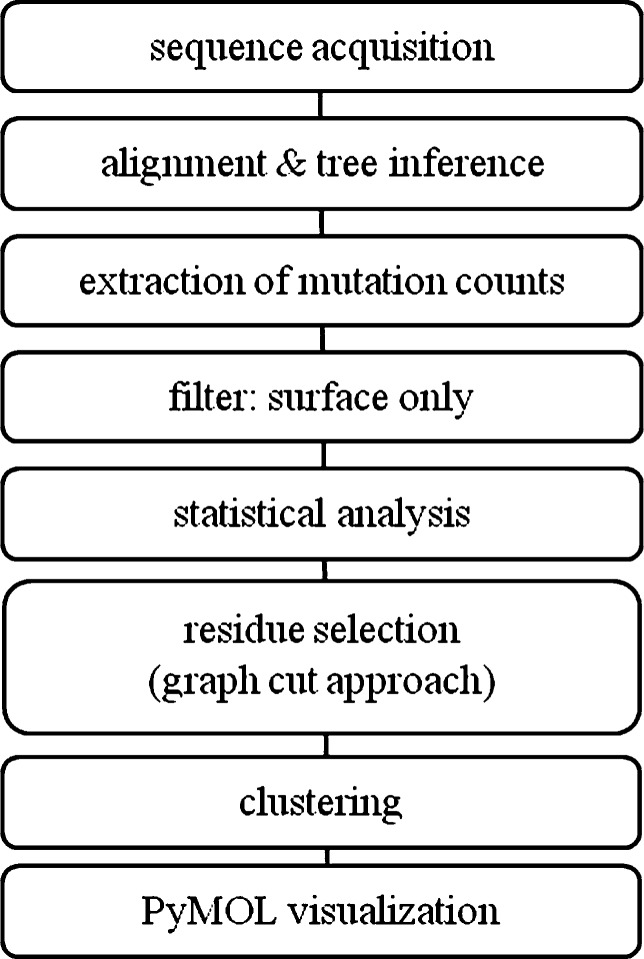
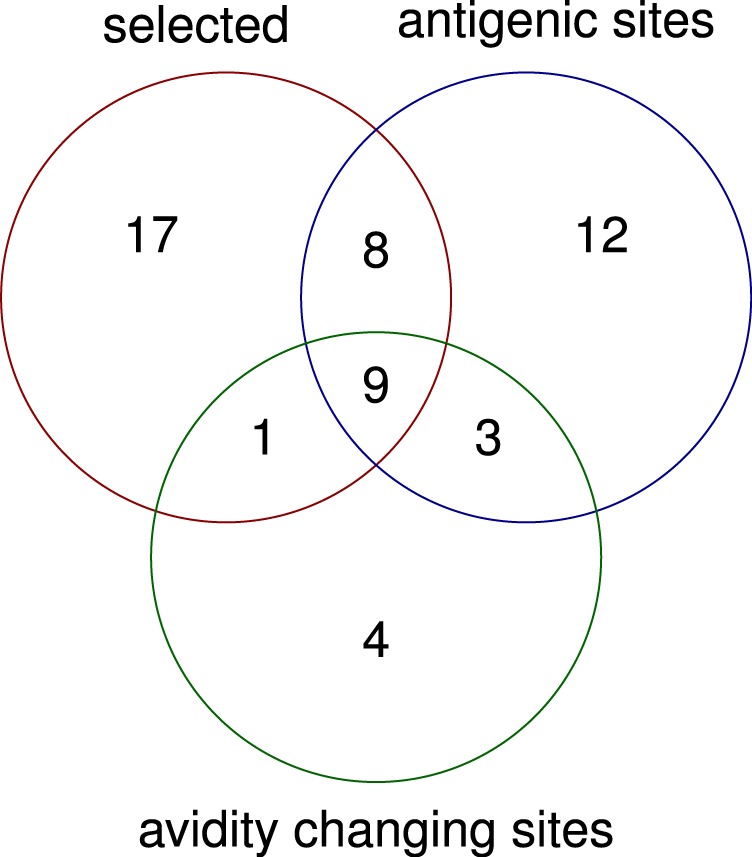
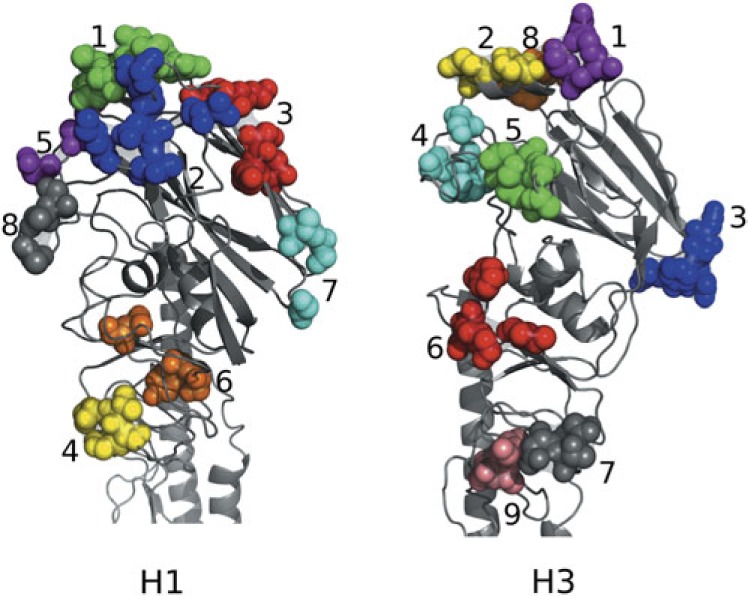
Influenza A viruses are single-stranded RNA viruses capable of evolving rapidly to adapt to environmental conditions. Examples include the establishment of a virus in a novel host or an adaptation to increasing immunity within the host population due to prior infection or vaccination against a circulating strain. Knowledge of the viral protein regions under positive selection is therefore crucial for surveillance. We have developed a method for detecting positively selected patches of sites on the surface of viral proteins, which we assume to be relevant for adaptive evolution. We measure positive selection based on dN/dS ratios of genetic changes inferred by considering the phylogenetic structure of the data and suggest a graph-cut algorithm to identify such regions. Our algorithm searches for dense and spatially distinct clusters of sites under positive selection on the protein surface. For the hemagglutinin protein of human influenza A viruses of the subtypes H3N2 and H1N1, our predicted sites significantly overlap with known antigenic and receptor-binding sites. From the structure and sequence data of the 2009 swine-origin influenza A/H1N1 hemagglutinin and PB2 protein, we identified regions that provide evidence of evolution under positive selection since introduction of the virus into the human population. The changes in PB2 overlap with sites reported to be associated with mammalian adaptation of the influenza A virus. Application of our technique to the protein structures of viruses of yet unknown adaptive behavior could identify further candidate regions that are important for host-virus interaction.
Figures


Similar articles
-
Selection pressure on the hemagglutinin gene of influenza A (H1N1) virus: adaptation to human and swine hosts in Asia.Acta Virol. 2010;54(2):113-8. doi: 10.4149/av_2010_02_113. Acta Virol. 2010. PMID: 20545440
-
The evolution of human influenza A viruses from 1999 to 2006: a complete genome study.Virol J. 2008 Mar 7;5:40. doi: 10.1186/1743-422X-5-40. Virol J. 2008. PMID: 18325125 Free PMC article.
-
Prevalence of epistasis in the evolution of influenza A surface proteins.PLoS Genet. 2011 Feb;7(2):e1001301. doi: 10.1371/journal.pgen.1001301. Epub 2011 Feb 17. PLoS Genet. 2011. PMID: 21390205 Free PMC article.
-
Positive selection on the H3 hemagglutinin gene of human influenza virus A.Mol Biol Evol. 1999 Nov;16(11):1457-65. doi: 10.1093/oxfordjournals.molbev.a026057. Mol Biol Evol. 1999. PMID: 10555276
-
[Swine influenza virus: evolution mechanism and epidemic characterization--a review].Wei Sheng Wu Xue Bao. 2009 Sep;49(9):1138-45. Wei Sheng Wu Xue Bao. 2009. PMID: 20030049 Review. Chinese.
Cited by
-
Survival trade-offs in plant roots during colonization by closely related beneficial and pathogenic fungi.Nat Commun. 2016 May 6;7:11362. doi: 10.1038/ncomms11362. Nat Commun. 2016. PMID: 27150427 Free PMC article.
-
Insights into the antigenic advancement of influenza A(H3N2) viruses, 2011-2018.Sci Rep. 2019 Feb 25;9(1):2676. doi: 10.1038/s41598-019-39276-1. Sci Rep. 2019. PMID: 30804469 Free PMC article.
-
The influenza virus hemagglutinin head evolves faster than the stalk domain.Sci Rep. 2018 Jul 11;8(1):10432. doi: 10.1038/s41598-018-28706-1. Sci Rep. 2018. PMID: 29992986 Free PMC article.
-
Computational prediction of vaccine strains for human influenza A (H3N2) viruses.J Virol. 2014 Oct;88(20):12123-32. doi: 10.1128/JVI.01861-14. Epub 2014 Aug 13. J Virol. 2014. PMID: 25122778 Free PMC article.
-
EDEN: evolutionary dynamics within environments.Bioinformatics. 2017 Oct 15;33(20):3292-3295. doi: 10.1093/bioinformatics/btx394. Bioinformatics. 2017. PMID: 28637301 Free PMC article.
References
-
- Altschul SF, Gish W, Miller W, Myers EW, Lipman DJ. Basic local alignment search tool. J Mol Biol. 1990;215:403–410. - PubMed
-
- Aoyama T, Nobusawa E, Kato H. Comparison of complete amino acid sequences among 13 serotypes of hemagglutinins and receptor-binding properties of influenza A viruses indirect immunofluorescence. Mutagenesis. 1991;182:475–485. - PubMed
-
- Benjamini Y, Yekutieli D. The control of the false discovery rate in multiple testing under dependency. Ann Stat. 2001;29:1165–1188.
-
- Berglund AC, Wallner B, Elofsson A, Liberles DA. Tertiary windowing to detect positive diversifying selection. J Mol Biol. 2005;60:499–504. - PubMed
Publication types
MeSH terms
Substances
LinkOut - more resources
Full Text Sources
