. 2012 May 2;31(9):2076-89.
doi: 10.1038/emboj.2012.11. Epub 2012 Mar 13.

Cohesin-SA1 deficiency drives aneuploidy and tumourigenesis in mice due to impaired replication of telomeres

Affiliations

Cohesin-SA1 deficiency drives aneuploidy and tumourigenesis in mice due to impaired replication of telomeres

Silvia Remeseiro et al. EMBO J. .

Abstract

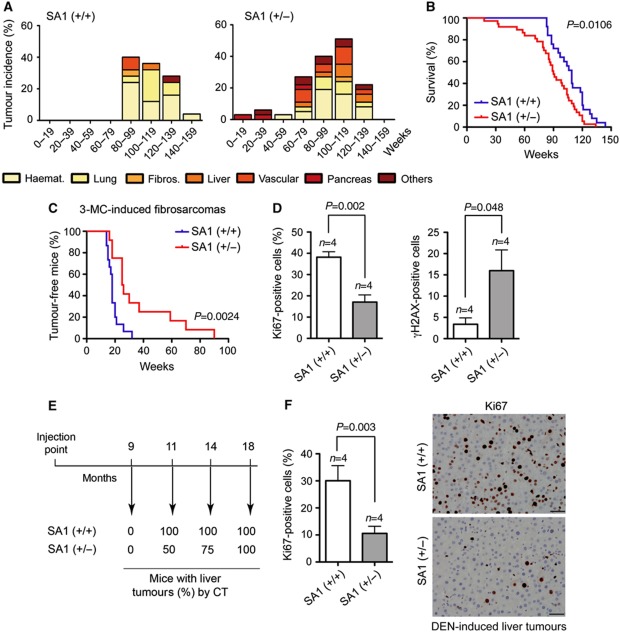
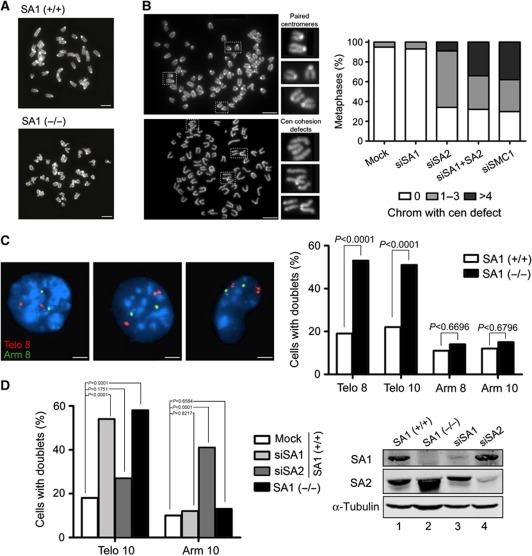
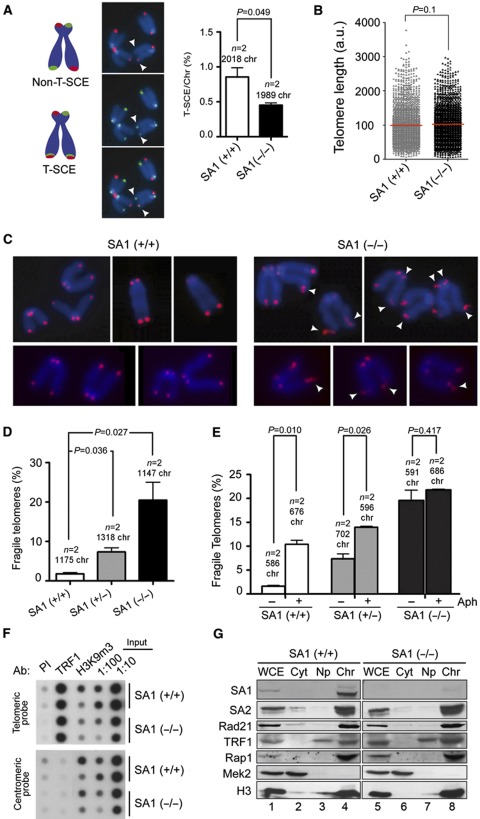
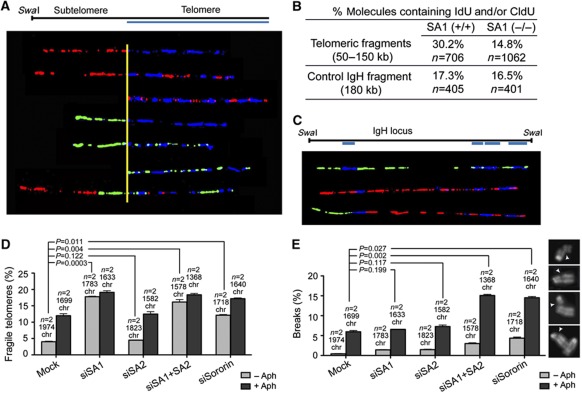
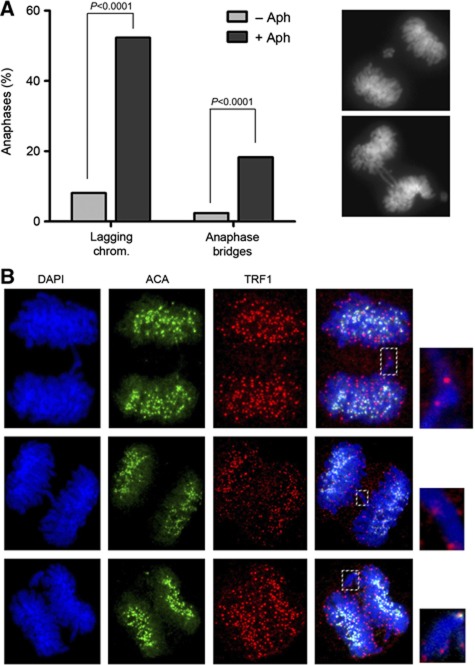
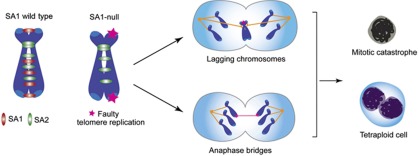
Cohesin is a protein complex originally identified for its role in sister chromatid cohesion, although increasing evidence portrays it also as a major organizer of interphase chromatin. Vertebrate cohesin consists of Smc1, Smc3, Rad21/Scc1 and either stromal antigen 1 (SA1) or SA2. To explore the functional specificity of these two versions of cohesin and their relevance for embryonic development and cancer, we generated a mouse model deficient for SA1. Complete ablation of SA1 results in embryonic lethality, while heterozygous animals have shorter lifespan and earlier onset of tumourigenesis. SA1-null mouse embryonic fibroblasts show decreased proliferation and increased aneuploidy as a result of chromosome segregation defects. These defects are not caused by impaired centromeric cohesion, which depends on cohesin-SA2. Instead, they arise from defective telomere replication, which requires cohesion mediated specifically by cohesin-SA1. We propose a novel mechanism for aneuploidy generation that involves impaired telomere replication upon loss of cohesin-SA1, with clear implications in tumourigenesis.


Conflict of interest statement

The authors declare that they have no conflict of interest.

Figures

Figure 1
Figure 1
A knockout mouse model for cohesin-SA1 subunit. (A) Schematic representation of the Stag1-knockout (KO) allele used in this study. The murine Stag1 locus encoding SA1 contains 34 exons. The precise location of the gene trap cassette is indicated as well as the position of the primers used for genotyping. LTR, long terminal repeat; SA, splice acceptor; βgeo, β-galactosidase/neomycin phosphotransferase fusion gene; pA, polyadenylation sequence; triangles represent target sites for FLPe and Cre recombinases (Schnutgen et al, 2005). (B) X-gal staining of whole embryos carrying the KO allele in heterozygosis (left) and homozygosis (right), and PCR analysis of DNA purified from cells of the indicated genotypes. (C) Quantitative RT–PCR analysis to evaluate the mRNA levels of SA1 and SA2 in the indicated MEFs. Values are given as picograms per 2 μg of total RNA. (D) Western blot analysis of whole-cell extracts prepared from MEFs. Tubulin is used as loading control. (E) Growth curves of primary MEFs of the indicated genotypes (left) and representative images of the cultures by day 6 after plating the same number of cells. (F) DNA content profile of asynchronous wild-type and SA1-null primary MEFs. Percentage of cells in each phase of the cell cycle is shown. (G) Graph showing the distribution in the number of chromosomes of at least 100 metaphases from two clones of wild-type, two clones of heterozygous and six clones of SA1-null primary MEFs. (H) Same analysis carried out in cells from fetal livers. At least 150 metaphases from three wild-type and three SA1-null embryos were examined. (I) E18.5 embryos from the same litter were photographed and genotyped. Notice the reduced size of the SA1-null embryos. (J) BrdU staining of skin and kidney sections from E17.5 embryos of the indicated genotypes. Arrowheads point to proliferative areas, such as hair follicles in the skin (top panels) and the outer layer of the kidney (bottom panels). Automated quantification of the relative BrdU-positive area in whole embryo sections with Definiens Software shows a clear reduction of 23.4±0.7% in SA1-null embryos with respect to wild-type (n=4 wild-type embryos and n=5 SA1-null E17.5 embryos were analysed). Scale bars, 200 μm (top) and 100 μm (bottom).
Figure 2
Figure 2
Reduced lifespan and increased incidence of spontaneous tumours in SA1 heterozygous mice, but higher resistance against chemically induced tumours. (A) Tumour incidence in wild-type (n=25) and SA1 heterozygous mice (n=37) relative to animal age in weeks. Note that SA1 heterozygous mice present higher tumour incidence and earlier onset of tumourigenesis. Haematopoietic tumours, fibrosarcomas, lung, liver, vascular and pancreas tumours are represented; the category ‘others’ includes osteomas, papillomas and mammary gland tumours. (B) Kaplan–Meier survival curves for wild-type (blue) and SA1 heterozygous mice (red) (n=25 and 37, respectively). (C) Kaplan–Meier curves showing tumour-free survival for wild-type and SA1 heterozygous mice injected with 3-MC to induce fibrosarcomas (n=15 animals per genotype). (D) Quantification of cells showing positive staining for Ki67 and γH2AX on tissue sections from fibrosarcomas like those shown in Supplementary Figure S2D. Five fields were counted per mouse of a total of four mice of each genotype. (E) Wild-type and SA1 heterozygous 15-day-old male mice (n=4 each) were injected with DEN and appearance of liver tumours was assessed by computed tomography (CT) at the indicated times after injection. (F) Quantification of Ki67-positive cells (left) in tissue sections of the liver tumours induced by DEN (right). Five fields were counted per mouse of a total of four mice of each genotype. Scale bars, 50 μm.
Figure 3
Figure 3
A specific role of SA1 in telomere cohesion. (A) Metaphase spreads from wild-type and SA1-null MEFs showing proper centromere cohesion. Scale bars, 10 μm. (B) Metaphase spreads from mouse C2C12 cells treated with control (top panel) and siRNA against SA2 (bottom panel) are shown as examples of proper and defective centromere cohesion, respectively. Scale bars, 10 μm. On the right, bar graph with the quantification of metaphase cells showing none, 1–3 or ⩾4 chromosomes with split centromeres after treatment with the indicated siRNAs (n⩾200 metaphases per condition from two independent experiments). (C) FISH analysis of wild-type or SA1-null primary MEFs in interphase with probes from the subtelomeric regions of chromosome 8 and 10 (Telo 8 and Telo 10) and arm regions of the same chromosomes (Arm 8 and Arm 10). n⩾100 cells per clone from two independent clones per genotype. Scale bars, 5 μm. (D) FISH analysis performed as in (C) in wild-type primary MEFs untransfected or transfected with siRNAs against SA1 (siSA1) or SA2 (siSA2). n⩾100 cells per condition.
Figure 4
Figure 4
Telomere fragility in the absence of SA1. (A) T-SCE measured by CO-FISH (chromosome orientation FISH) in the telomeres of primary MEFs. The drawing on the left explains how T-SCE are visualized. The images on the middle show an example in which the telomeres indicated by arrowheads have undergone exchange since they are labelled by both the leading and the lagging strand-specific telomeric probes (green and red, respectively). Quantification of exchange events is shown in the bar graph on the right. (B) Telomere length measured by Q-FISH (quantitative FISH) for telomeres from wild-type and SA1-null MEFs (12 metaphase cells from two clones for each genotype). (C) Metaphase chromosomes from wild-type and SA1-null MEFs stained with a telomeric repeat probe (red) and DAPI (blue). Arrowheads point to fragile telomeres. (D) Quantification of fragile telomeres in chromosomes from two clones each of wild-type, SA1 (+/−) and SA1-null MEFs. (E) Telomere fragility measured in wild-type, SA1 (+/−) and SA1-null MEFs either untreated (−) or treated (+) with 0.5 μM aphidicolin for 24 h. In all cases two clones of each genotype were used. (F) ChIP-dot blot analysis of two clones each of wild-type and SA1-null MEFs with preimmune serum as negative control (PI), anti-TRF1 and anti-H3K9m3 as positive control. The chromatin obtained was transferred to a membrane and hybridized with a telomeric probe and a centromeric probe (major satellite) as control. TRF1 is present only at telomeres and its abundance is not affected by the lack of SA1. (G) Chromatin fractionation followed by immunoblotting with antibodies against cohesin subunits and shelterin proteins in wild-type and SA1-null cells. Mek2 cytoplasmatic kinase and histone H3 are used as control for the fractionation procedure. WCE, whole-cell extract; Cyt, cytoplasm; Np, nucleoplasm; Chr, chromatin fraction. The amount of TRF1 and Rap1 in chromatin does not depend on SA1 (lanes 4 and 8).
Figure 5
Figure 5
SMARD analysis of telomeric DNA reveals defective replication in SA1-null MEFs upon loss of telomere cohesion. (A) Examples of stretched telomeric DNA molecules of variable lengths (50–150 kb), identified by FISH with a telomeric probe (blue), that incorporated IdU (red) and/or CldU (green) during the time of the pulses. (B) Results of the SMARD analysis for telomeres (top) and molecules containing the IgH locus as control (bottom) from wild-type and SA1-null MEFs. (C) Examples of IdU/CldU (red/green) incorporation patterns in SwaI-digested fragments (180 kb) corresponding to the IgH locus, as identified by FISH with the indicated probes (blue). (D) Quantification of fragile telomeres in mouse C2C12 cells treated with no siRNA (mock) or siRNAs against SA1 (siSA1), SA2 (siSA2) or both (siSA1+SA2) or Sororin (siSororin), either in the absence (grey bars) or in the presence of aphidicolin (black bars) as in Figure 4E. (E) Quantification of breaks along the chromosome arms in the indicated cells either untreated (grey bars) or treated with aphidicolin (black bars). The images on the right show examples of the broken chromosomes.
Figure 6
Figure 6
Chromosome segregation defects in SA1-null cells. (A) Graphical summary of the fates of mitotic cells from wild-type (n=88) and SA1-null MEFs (n=86) observed by live-cell imaging. Each line represents the progression through mitosis of a single cell and it is coloured according to the legend shown below the graph. (B) Examples of wild-type and SA1-null MEFs progressing through mitosis after transfection with H2B-mCherry (red) to label chromatin. The time after NEBD for each frame is indicated. Examples of a normal mitosis (top), a mitosis that leads to the formation of a binucleated cell (middle) and a mitosis that ends up in cell death (bottom) are shown. (C) Aberrant anaphases in SA1 (+/−) and SA1-null MEFs. Examples of a proper anaphase (top), an anaphase with a lagging chromosome (middle) and an anaphase with a chromatin bridge (bottom) are shown (n⩾50 cells per clone from two independent clones per genotype).
Figure 7
Figure 7
Defective telomere replication causes chromosome missegregation. (A) Frequency of anaphase bridges and lagging chromosomes in wild-type MEFs untreated (–Aph) or treated (+Aph) with low doses of aphidicolin (0.5 μM 24 h). Examples of chromosome segregation defects induced by global inhibition of replication are shown on the right. (B) Examples of SA1-null anaphase cells with chromosome segregation problems stained with antibodies against TRF1 (red) and ACA (green). Cells were pre-extracted with detergent before fixation. The top and middle panels show the presence of telomeres but no centromeres at the chromatin bridges. The bottom panel shows a lagging chromosome containing two sister chromatids. Confocal microscopy was used to ensure that TRF1 signals were in the same focal plane as the DNA.
Figure 8
Figure 8
The role of cohesin-SA1 in telomere cohesion and replication is essential for accurate chromosome segregation and to prevent aneuploidy. See text for details on the model.

Comment in

Similar articles

Cited by

References

    1. Anderson DE, Losada A, Erickson HP, Hirano T (2002) Condensin and cohesin display different arm conformations with characteristic hinge angles. J Cell Biol 156: 419–424 - PMC - PubMed
    1. Badie S, Escandell JM, Bouwman P, Carlos AR, Thanasoula M, Gallardo MM, Suram A, Jaco I, Benitez J, Herbig U, Blasco MA, Jonkers J, Tarsounas M (2010) BRCA2 acts as a RAD51 loader to facilitate telomere replication and capping. Nat Struct Mol Biol 17: 1461–1469 - PMC - PubMed
    1. Bailey SM, Brenneman MA, Goodwin EH (2004) Frequent recombination in telomeric DNA may extend the proliferative life of telomerase-negative cells. Nucleic Acids Res 32: 3743–3751 - PMC - PubMed
    1. Benetti R, Gonzalo S, Jaco I, Schotta G, Klatt P, Jenuwein T, Blasco MA (2007) Suv4-20 h deficiency results in telomere elongation and derepression of telomere recombination. J Cell Biol 178: 925–936 - PMC - PubMed
    1. Canudas S, Smith S (2009) Differential regulation of telomere and centromere cohesion by the Scc3 homologues SA1 and SA2, respectively, in human cells. J Cell Biol 187: 165–173 - PMC - PubMed

Publication types

MeSH terms

LinkOut - more resources