. 2012;8(3):e1002531.
doi: 10.1371/journal.pgen.1002531. Epub 2012 Mar 8.

A machine learning approach for identifying novel cell type-specific transcriptional regulators of myogenesis

Affiliations

A machine learning approach for identifying novel cell type-specific transcriptional regulators of myogenesis

Brian W Busser et al. PLoS Genet. 2012.

Abstract

Transcriptional enhancers integrate the contributions of multiple classes of transcription factors (TFs) to orchestrate the myriad spatio-temporal gene expression programs that occur during development. A molecular understanding of enhancers with similar activities requires the identification of both their unique and their shared sequence features. To address this problem, we combined phylogenetic profiling with a DNA-based enhancer sequence classifier that analyzes the TF binding sites (TFBSs) governing the transcription of a co-expressed gene set. We first assembled a small number of enhancers that are active in Drosophila melanogaster muscle founder cells (FCs) and other mesodermal cell types. Using phylogenetic profiling, we increased the number of enhancers by incorporating orthologous but divergent sequences from other Drosophila species. Functional assays revealed that the diverged enhancer orthologs were active in largely similar patterns as their D. melanogaster counterparts, although there was extensive evolutionary shuffling of known TFBSs. We then built and trained a classifier using this enhancer set and identified additional related enhancers based on the presence or absence of known and putative TFBSs. Predicted FC enhancers were over-represented in proximity to known FC genes; and many of the TFBSs learned by the classifier were found to be critical for enhancer activity, including POU homeodomain, Myb, Ets, Forkhead, and T-box motifs. Empirical testing also revealed that the T-box TF encoded by org-1 is a previously uncharacterized regulator of muscle cell identity. Finally, we found extensive diversity in the composition of TFBSs within known FC enhancers, suggesting that motif combinatorics plays an essential role in the cellular specificity exhibited by such enhancers. In summary, machine learning combined with evolutionary sequence analysis is useful for recognizing novel TFBSs and for facilitating the identification of cognate TFs that coordinate cell type-specific developmental gene expression patterns.


Conflict of interest statement

The authors have declared that no competing interests exist.

Figures

Figure 1
Figure 1. Schematic of enhancer classification beginning with a small training set.
A small set of known enhancers active in similar cells is increased by incorporating orthologous sequences. De novo and known motifs are mapped onto this training set and a set of control sequences. Feature vectors are used to build an enhancer model based upon the learned motif weighting. This model can be used to scan the genome for similar enhancers as the training set. These predictions can be tested using transgenic reporter assays or analysis of the expression of the associated gene. The motif weighting can likewise be used to identify novel classes of transcriptional regulators. The role of the motifs can be tested in cis and the identification of co-regulating TFs can be subsequently tested in trans.
Figure 2
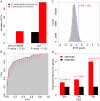
Figure 2. The enhancer classifier performs with high specificity and sensitivity.
(A) Over-representation of TFBSs in the training set including only D. melanogaster enhancers and in the set extended using phylogenetic profiling, as compared with background sequence. P-values were adjusted for multiple testing using the method of Benjamini and Hochberg (BH) . (B) Average ROC curve for the 10-fold cross-validation. Our method achieves an area under the ROC curve of 0.89 (shaded in gray). FPR: false-positive rate; TPR: true-positive rate. (C) Distribution of FC enhancer scores for the genome-wide scan. Scores assigned by the classifier for each evaluated sequence are shown in red. We used a FPR of 5% to define a cut-off for putative enhancers (dotted blue line; see Materials and Methods for details). (D) Fold-enrichment in 180 validated FC genes in the neighborhood of putative FC enhancers, as determined for different FPRs. Intergenic putative FC enhancers were associated with the closest gene, whereas intronic sequences were associated with their host gene. P-values were computed using the binomial test.
Figure 3
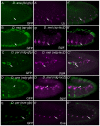
Figure 3. Orthologous sequences are functional enhancers.
GFP (green) expression in transgenic stage 11 D. melanogaster embryos containing the indicated GFP reporter constructs driven by the D. ananassae lbl (A), D. mojavensis ap (B), D. persimilis Ndg (C), D. ananassae Ndg (D), and D. persimilis eve (E) enhancers. Co-expression of GFP driven by the D. ananassae lbl enhancer with endogenous Lbl protein (magenta, A′) and D. persimilis eve enhancer with endogenous Eve protein (magenta, E′). β-Gal driven by the D. melanogaster versions of the Ndg (C′, D′) and ap (B′) enhancer co-expresses in some but not all mesodermal cells with GFP driven by the orthologous sequences.
Figure 4
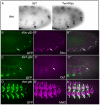
Figure 4. Candidate enhancers predicted by the classifier are active in FCs.
In situ hybridization of dve in wild-type (WT) embryos and embryos over-expressing Ras (Twi>Ras) in the mesoderm (A). Note the increased activity of dve in Twi>Ras embryos, indicative of a FC gene . GFP driven by the classifier-predicted enhancers associated with the upstream sequences of slou (arrows in B) and slp1 (arrows in C). Slou protein (magenta) co-expresses with GFP (green) in slou-GFP embryos (B). Duf (magenta), which marks all FCs, co-expresses with slp1-GFP (green) (C). GFP (D) driven by the classifier-predicted intronic sequence associated with the dve gene co-expresses with Mef2 (D′) in myotubes at stage 15 in dve-GFP embryos.
Figure 5
Figure 5. DNA binding domains of the TFs most relevant to FC enhancer classification.
Only DNA binding domains for the fifty most relevant TFs have been included. TFs were ranked according to the SVM weights of their respective motifs, which represent their discriminating power. Only the highest scoring motif for each TF was considered (median ranks computed across 10 random partitions of the training data varied between 12 and 117). De novo motifs were explicitly excluded from this analysis. TF domains and sequences have been clustered using average linkage and Euclidean distance. The dendogram on top of the heatmap represents the relationships among the sequences in the training data, built on the presence/absence of TFBSs recognized by a specific class of TF DNA binding domain. The dendogram on the left of the heatmap shows the relationships among the different TF DNA binding domains.
Figure 6
Figure 6. The wild-type activities of FC enhancers require input from classifier-defined Myb and POUHD TF binding motifs.
(A) TRANSFAC position weight matrices for Myb (V$MYB_Q6) and POUHD (V$POU1F1_Q6) enriched motifs identified by the classifier. (B) Binding site sequences in the Ndg enhancer for Myb and POUHD and versions in which those sites are selectively mutated. Motifs were defined by searching for matches to the vertebrate homologues in the UniPROBE database . The identification of these binding sites and the designs of the mutant versions are described in Table S4. (C) GFP (green) and β-Gal (magenta) are co-expressed when driven by the wild-type (WT) Ndg enhancer (NdgWT-GFP and NdgWT-lacZ, respectively). (D) GFP (green) expression driven by a version of the Ndg enhancer in which POUHD sites are selectively inactivated (NdgPOUHD-GFP) is significantly reduced compared to β-Gal (magenta) driven by NdgWT-lacZ. (E) β-Gal driven by a version of the Ndg enhancer in which Myb binding sites are selectively inactivated (NdgMyb-lacZ) is de-repressed into additional somatic mesodermal cells compared to GFP driven by a WT version of the Ndg enhancer (NdgWT-GFP).
Figure 7
Figure 7. The T-box TF org-1 is a regulator of the lbl and slou FC enhancers.
(A) TRANSFAC position weight matrix for Tbx5 (V$Tbx5_Q5), a vertebrate homolog of the Drosophila T-box TF org-1 and a top-scoring feature derived by the FC enhancer classifier. (B, C) In stage 11 embryos containing the lbl WT-lacZ transgene, β-Gal (green) co-expresses with endogenous Lb (red) in three cells (arrow) but is absent from Slou-expressing FCs (blue, arrowhead). (D, E) Mutagenesis of T-box motifs in the lbl FC enhancer (lbl Tbox-lacZ) results in an attenuation of β-Gal (green) reporter activity in the three Lbl-expressing cells (red, arrow). Wild-type and mutant T-box binding sites in the lbl FC enhancer are described in Table S4. (F, G) GFP (green) co-expresses with endogenous Slou (red) in two cells (arrowhead) but not in the three Lbl- expressing cells (blue, arrow) in stage 11 embryos containig the slou WT-gfp transgene. (H, I) Mutagenesis of T-box motifs in the slou FC enhancer (slou Tbox-lacZ) results in a marked attenuation of β-Gal (green, arrow) expression in two Slou-expressing cells (red, arrowhead). The asterisks denote de-repression of the lacZ reporter in cells of unknown identity. Wild-type and mutant T-box binding sites in the slou FC enhancer are described in Table S4. (J) GFP (green) fluorescence expression in living stage 14 lbl-GFP embryos is visible in the SBM (arrowhead), in two adult muscle precursors and in several cells of the central nervous system (asterisks) injected with control lacZ dsRNA. (K) Loss of GFP fluorescence from cells corresponding to the wild-type positions of the SBM and two adult muscle precursors but not in cells of the central nervous system (asterisks) in living stage 14 lbl-GFP embryos injected with org-1 dsRNA. (L) GFP (green) fluorescence expression in living stage 14 slou-GFP embryos is visible in muscles LO1 (arrow) and VT1 (arrowhead) injected with control lacZ dsRNA. (M) Loss of GFP fluorescence from cells corresponding to the wild-type positions of LO1 and VT1 in living stage 14 slou-GFP embryos injected with org-1 dsRNA. (N) Co-expression in the segment border muscle (SBM; arrowhead) of endogenous Lbl (red) and β-Gal in stage 14 lblWT-lacZ embryos containing the lblWT-lacZ transgene. (O) Panmesodermal expression of org-1 (Twi>org-1) in stage 14 lblWT-lacZ embryos induces ectopic activation of both endogenous Lb (red) and the β-Ggal reporter reporter (green). (P) Stage 16 wild-type (WT) embryo stained with antibodies directed against myosin heavy chain (MHC; green), Lb (red) and Slou (blue) showing expression of Lb in the single SBM (arrowhead) in each hemisegment. (Q) Panmesodermal expression of org-1 (Twi>org-1) induces duplication of the SBM in some but not all hemisegments (arrowheads). (R) GFP (green) fluorescence expression in living stage 16 MHC-tauGFP embryos is visible in the SBM (arrowhead) and muscle LO1 (arrow) injected with control lacZ dsRNA. (S) Loss of GFP fluorescence from cells corresponding to the wild-type positions of the SBM muscle LO1 in living stage 16 MHC-tauGFP embryos injected with org-1 dsRNA.
Figure 8
Figure 8. TFBS combinatorics within FC enhancers.
(A) Distribution of Tcf, Mad, Pnt, Twi, Tin, POUHD, Tbx, Myb, Fkh, HD and Mef2 TFBSs in FC enhancers. Binding sites for Tcf, Mad, Pnt, Twi and Tin were previously published . Motif matches for motifs most relevant to the classification for a given DNA binding domain class: POUHD (V$OCT_01, V$POU1F1_Q6, V$OCT4_02), Tbx (V$TBX5_01, I$BYN_Q6), Myb (V$MYB_Q6), Fkh (V$FOXO3_01, V$FOXO1_Q5, V$FREAC2_01), HD (I$ABDA_Q6, V$CDX5_Q5, V$IFP_03, V$PAX4_02), and Mef2 (V$AMEF2_Q6, V$HMEF2_Q6). These sites were mapped using MAST under default parameters . (B) A generic FC enhancer receives differential input from signal-activated, ubiquitous, tissue-restricted and cell type-specific TFs. HD binding motifs are represented as both tissue-restricted and cell type-specific classes since these motifs receive input from both Hox TFs, which are widely expressed in the mesoderm , , , and muscle identity HD TFs—such as Slou, Msh and Ap—which are cell type-specific , , . For this diagram, HD binding sites were not subdivided into the distinct binding profiles that have been identified for each individual HD TF (, and B. W. Busser, L. Shokri, S. A. Jaeger, S. S. Gisselbrecht, A. Singhania, M. F. Berger, B. Zhou, M. L. Bulyk and A. M. Michelson, unpublished data).

Similar articles

Cited by

References

    1. Carroll SB, Grenier JK, Weatherbee SD. From DNA to Diversity. Molecular Genetics and the Evolution of Animal Design. Malden, Massachusetts: Blackwell Publishing; 2005.
    1. Davidson E. 2006. 304 The Regulatory Genome: Gene Regulatory Networks In Development And Evolution: Academic Press.
    1. Berman BP, Nibu Y, Pfeiffer BD, Tomancak P, Celniker SE, et al. Exploiting transcription factor binding site clustering to identify cis-regulatory modules involved in pattern formation in the Drosophila genome. Proc Natl Acad Sci U S A. 2002;99:757–762. - PMC - PubMed
    1. Markstein M, Markstein P, Markstein V, Levine M. Genome-wide analysis of clustered Dorsal binding sites identifies putative target genes in the Drosophila embryo. Proc Natl Acad Sci U S A. 2002;99:763–768. - PMC - PubMed
    1. Philippakis AA, Busser BW, Gisselbrecht SS, He FS, Estrada B, et al. Expression-guided in silico evaluation of candidate cis regulatory codes for Drosophila muscle founder cells. PLoS Comput Biol. 2006;2:e53. doi: 10.1371/journal.pcbi.0020053. - DOI - PMC - PubMed

Publication types

Substances

LinkOut - more resources