. 2012 Mar 8;73(5):990-1001.
doi: 10.1016/j.neuron.2011.12.036.

Distinct neuronal coding schemes in memory revealed by selective erasure of fast synchronous synaptic transmission

Affiliations

Distinct neuronal coding schemes in memory revealed by selective erasure of fast synchronous synaptic transmission

Wei Xu et al. Neuron. .

Abstract

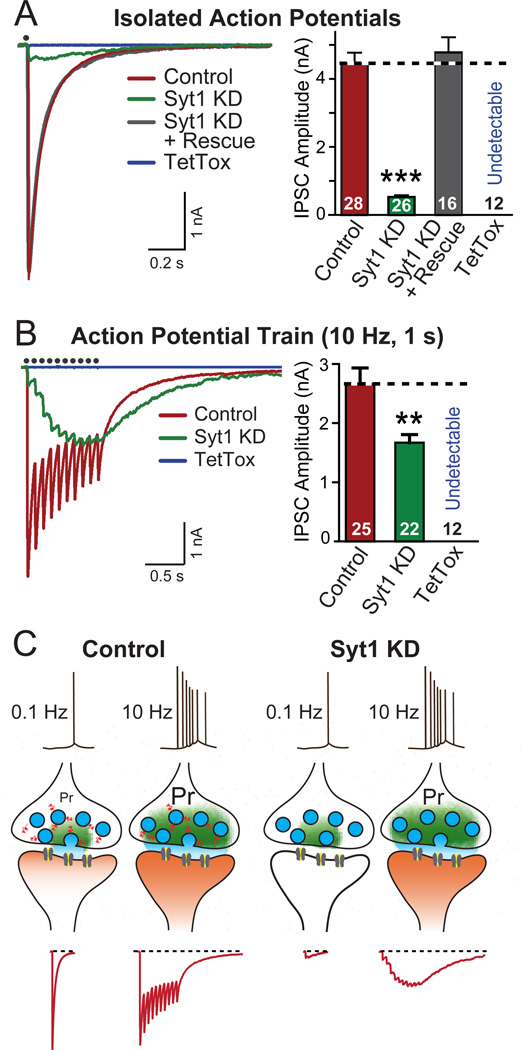
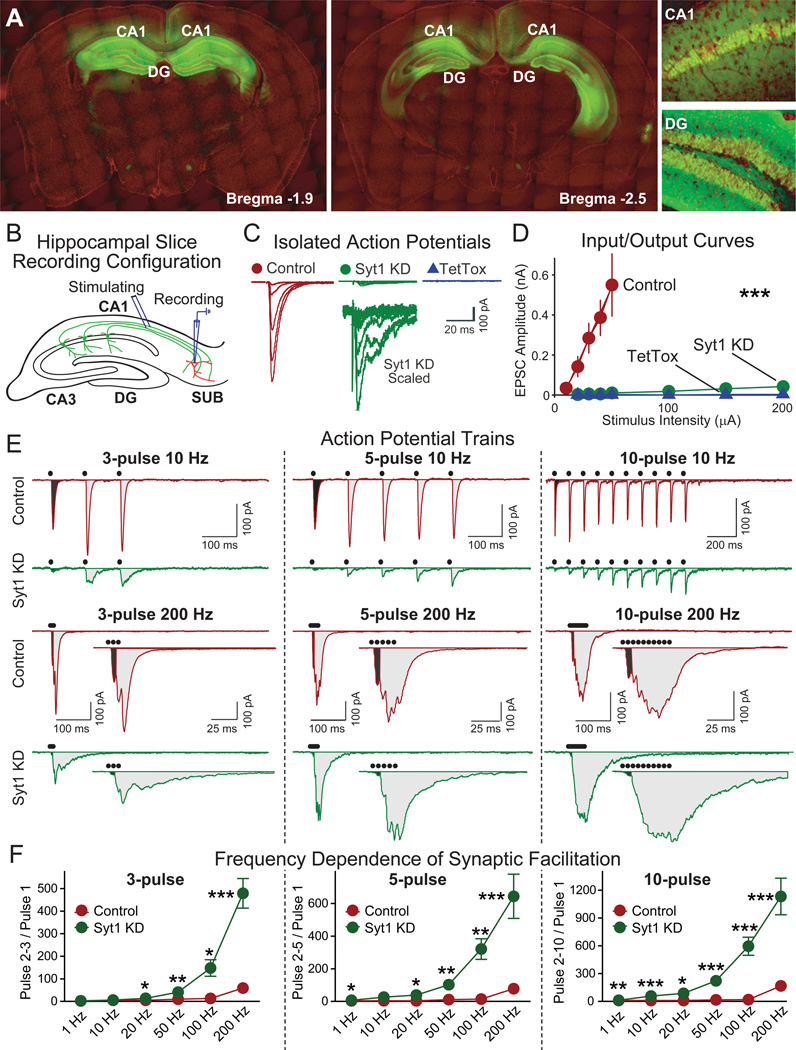
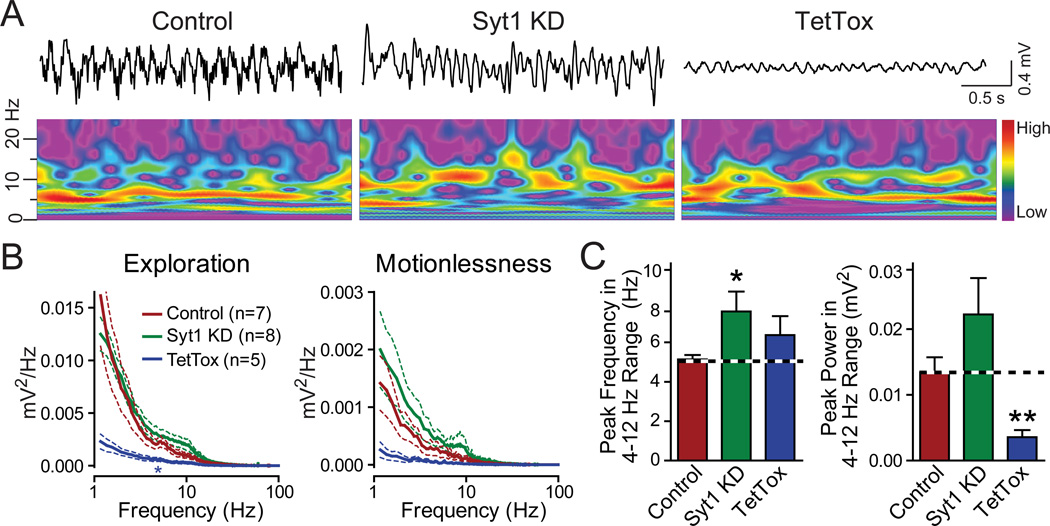
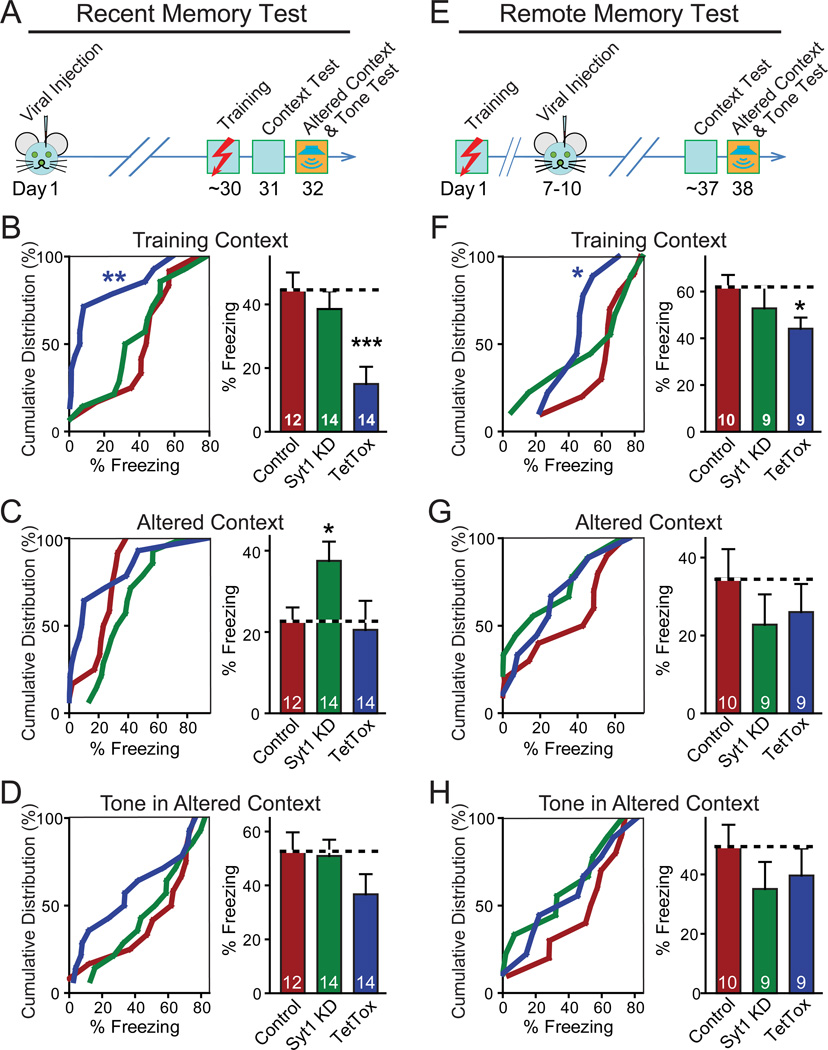
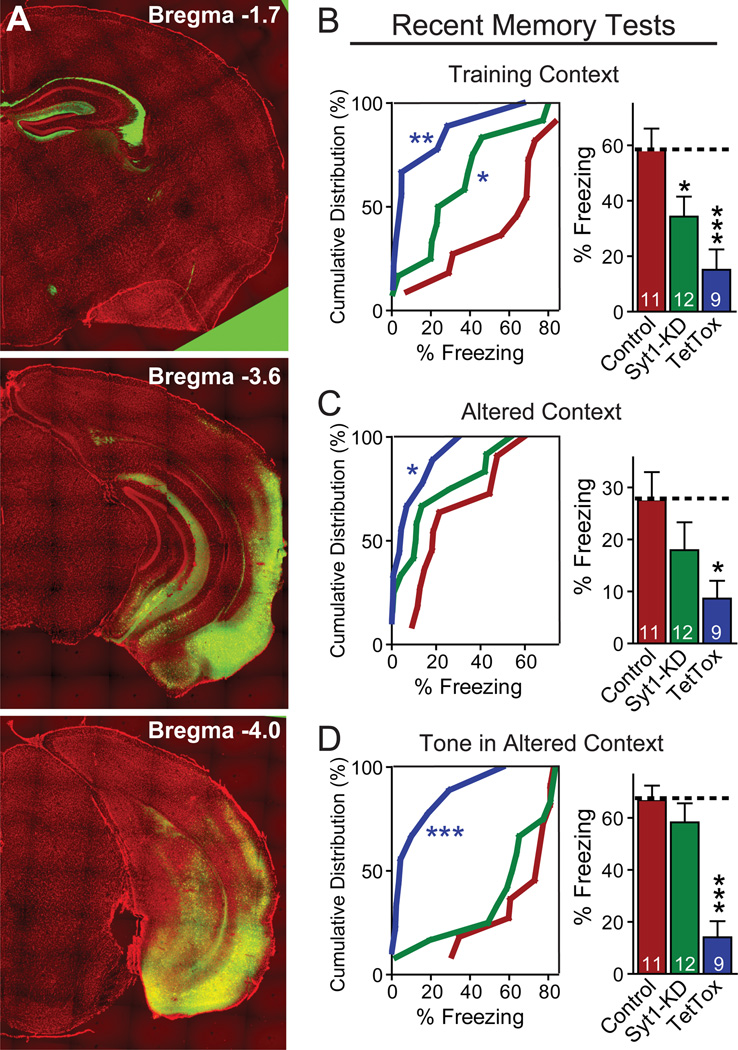
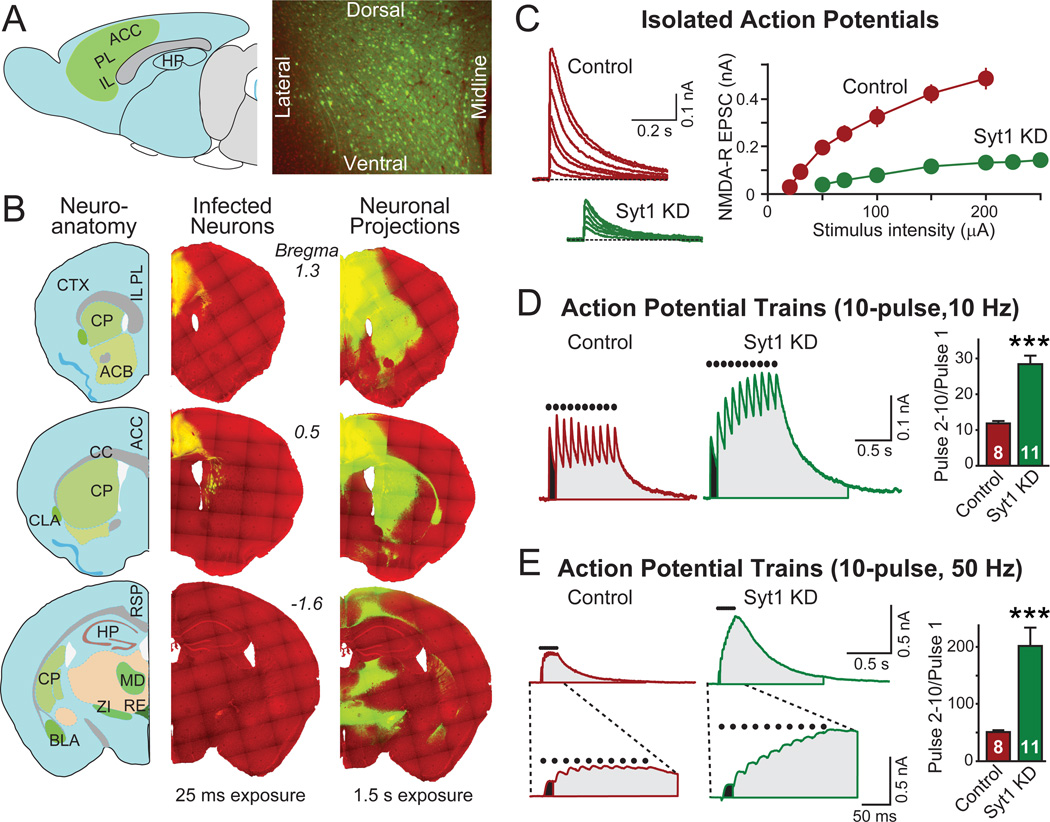
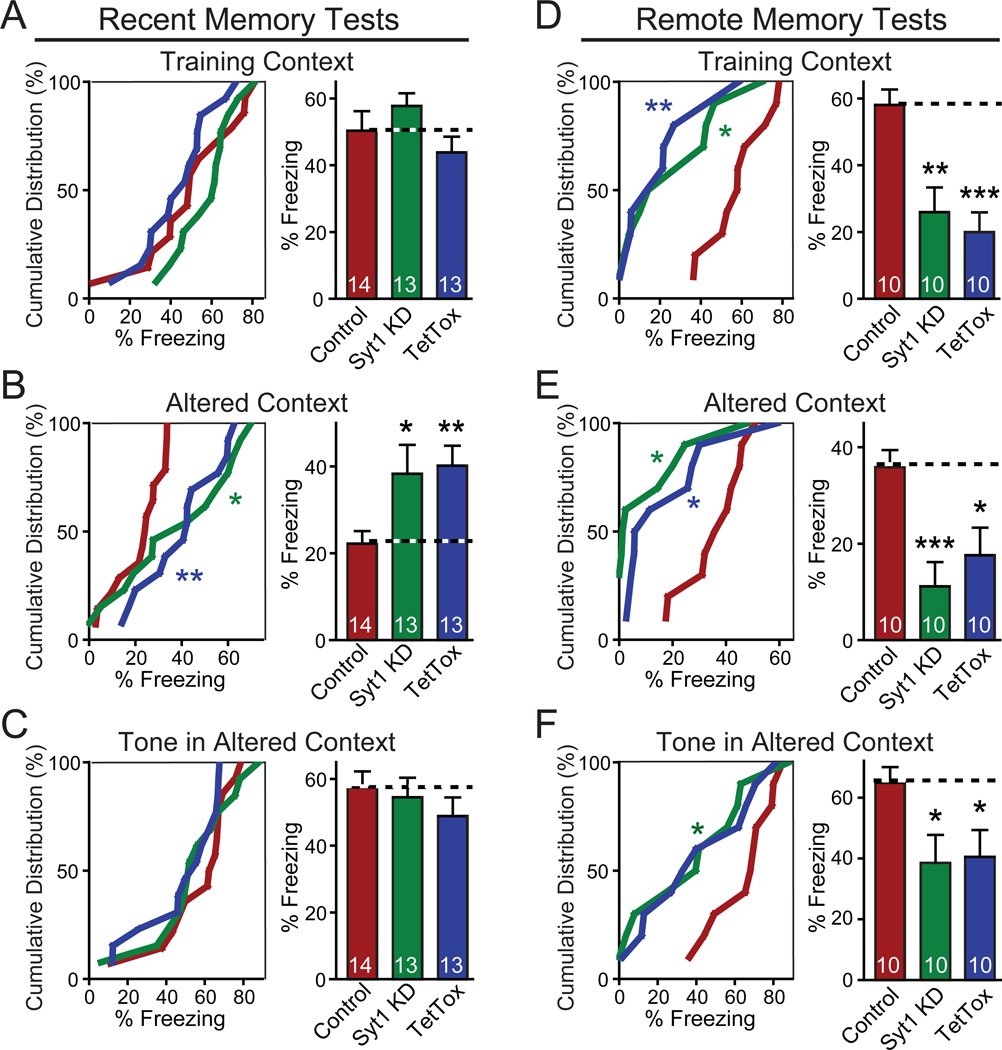
Neurons encode information by firing spikes in isolation or bursts and propagate information by spike-triggered neurotransmitter release that initiates synaptic transmission. Isolated spikes trigger neurotransmitter release unreliably but with high temporal precision. In contrast, bursts of spikes trigger neurotransmission reliably (i.e., boost transmission fidelity), but the resulting synaptic responses are temporally imprecise. However, the relative physiological importance of different spike-firing modes remains unclear. Here, we show that knockdown of synaptotagmin-1, the major Ca(2+) sensor for neurotransmitter release, abrogated neurotransmission evoked by isolated spikes but only delayed, without abolishing, neurotransmission evoked by bursts of spikes. Nevertheless, knockdown of synaptotagmin-1 in the hippocampal CA1 region did not impede acquisition of recent contextual fear memories, although it did impair the precision of such memories. In contrast, knockdown of synaptotagmin-1 in the prefrontal cortex impaired all remote fear memories. These results indicate that different brain circuits and types of memory employ distinct spike-coding schemes to encode and transmit information.


Figures

Figure 1
Figure 1. Syt1 KD Effectively Produces a High-pass Frequency Filter for Synaptic Transmission
(A) Representative traces (left) and summary graphs of amplitudes (right) of IPSCs recorded in cultured neurons infected with lentiviruses expressing mCherry alone (Control), or together with the Syt1 shRNA (Syt1 KD), Syt1 shRNA and Syt1 rescue protein (Syt1 KD + Rescue), or tetanus toxin ligh chain (TetTox). IPSCs were evoked by single-pulse stimuli, and recorded in whole-cell mode (red: control; green: Syt1 KD; gray: Syt1 KD + Rescue; blue: TetTox). Black dots on top of the traces indicate the time when stimulation was delivered. (B) Same as above, except that IPSCs were evoked by stimulus trains consisting 10 pulses at 10 Hz, and that the summary graphs depict charge transfers during the trains. (C) Schematic illustration of the synaptic effect of the Syt1 KD. Individual isolated spikes propagate to terminals and trigger Ca2+-dependent neurotransmitter release which is mediated by Syt1 as the Ca2+-sensor. The release probability (Pr) of typical forebrain synapses in response to an individual spike is low. Bursts of spikes increase the overall probability of release by leading to an accumulation of Ca2+, and thereby enhance the reliability of transmission. In Syt1 KD neurons, individual spike-triggered synchronous synaptic release — the majority of synaptic release — is blocked, but the accumulating Ca2+ stimulates unphysiological delayed release that is asynchronous and during longer stimulus trains produces the same overall synaptic transmission as synchronous release, although with a completely different kinetics. Data in A and B are means ± SEMs; numbers inside columns indicate the number of neurons analyzed in at least three independent experiments. Statistical significance was calculated by Student’s t-test (2-tailed), * p<0.05; ** p<0.01; *** p<0.001. For KD quantitation and additional high-frequency stimulation data, see Fig. S1.
Figure 2
Figure 2. Hippocampal Syt1 KD Erases Synchronous Synaptic Transmission
(A) Visualization of EGFP expression after stereotactic injection of EGFP-expressing AAVs into the CA1 and dentate gyrus (DG) regions of the dorsal hippocampus. Two coronal brain sections from the same mouse at different anterior-posterior positions are shown (green, EGFP; red, DAPI counterstain). Recombinant AAV-DJ viruses expressing EGFP were injected into the dorsal hippocampus of 2-month old mice, and EGFP expression was imaged 3 weeks later (CA1, CA1 region; DG, dentate gyrus). (B) Schematic drawing of the electrophysiological recording configuration used to analyze synapses formed by CA1 neurons onto subiculum neurons (SUB). CA1 axons were stimulated in the alveus, and whole-cell recordings were obtained from pyramidal neurons of the subiculum. (C, D) Representative traces (C) and summary graphs of amplitudes (D) of EPSCs elicited by isolated stimuli with increasing stimulation strength (control n=6, Syt1 KD n=12, TetTox n=9). (E, F) Representative traces (E) and summary graphs (F) of EPSCs evoked by stimulation trains consisting of 3, 5 or 10 pulses applied at frequencies ranging from 1–200 Hz. The black dots on top of the traces indicate stimulation time points. For the 200 Hz stimulus trains, the entire stimulus train traces are shown on top and the expanded traces of the initial time period are shown on the bottom. In F, facilitation was quantified as the ratio of the charge transfers produced by pulses 2–3, 2–5, or 2–10, respectively, to pulse 1 (for each group, n=5–18). Data are means ± SEM; Statistical significance between means was determined using Student’s t-test (* p<0.05, ** p<0.01; *** p<0.001). Measurements of long term potentiation (LTP) are shown in Figure S2.
Figure 3
Figure 3. In vivo recordings of CA1 local field potentials in freely moving mice
(A) Representative traces and wavelet spectra of CA1 local field potential recordings from mice receiving hippocampal injections of control, Syt1 KD or TetTox AAV, respectively. The colors of the wavelet spectrums are linearly scaled to the level of the power with red representing high power and purple indicating low power. (B) Averaged power spectra of CA1 local field recordings during different behavioral states. Data are means ± SEM; statistical significance between the means of power spectra in the 4–10 Hz range was determined by the repeated measures two-way ANOVA test (* p<0.05). (C) Quantitation of the peak frequency in the power spectrum in the theta range (4–12 Hz) and the power at the peak frequency. Data are means ± SEM; statistical significance between means was determined with Student’s t-test (* p<0.05, ** p<0.01).
Figure 4
Figure 4. Contextual Memory Persists after Syt1 KD in Hippocampus
(A) Design of experiments measuring recent fear memories. Note that fear conditioning was conducted as training context test to measure contextual memory, altered context test (similar cage, but changes in odor, cage floor, wall cues and background noise, etc.) to test the precision of memory, and tone test to measure memory of auditory cues. (B–D) Cumulative distribution (left) and bar graphs (right) of recent fear conditioning memory (measured as freezing) as a function of hippocampal injections of AAVs expressing the Syt1 KD or tetanus-toxin light chain (TetTox). (E) Design of experiments measuring remote fear memories. Note that the measurements of fear conditioning are identical to (A), but that the stereotactic viral injections occur after training. (F–H) Same as B–D, except that the experimental design measures remote memories. Data in bar graphs are means ± SEMs; numbers inside bars indicate the number of mice analyzed. Statistical significance between cumulative distributions was calculated by the Kolmogorov–Smirnov test (two-sample), and between groups (comparing Syt1 KD or TetTox to control) Student’s t test (2-tailed); * p<0.05; *** p<0.001. For analysis of basic behavioral and motor parameters, see Figure S3.
Figure 5
Figure 5. Syt1 KD in the entorhinal cortex modestly impairs recent memories
(A) Pattern of EGFP expression after AAV injection into the entorhinal cortex. Three coronal brain sections from the same mouse at different anterior-posterior positions are shown (green, EGFP; red, DAPI counterstain). Neurons in both medial and lateral entorhinal cortex were infected. Virus spread to the adjacent ventral subiculum and ventral hippocampus, with sparse infection of the cortical amygdalar area. Axonal fibers originating from the entorhinal cortex and terminating at the stratum lacunosum-moleculare of the hippocampus are apparent by expression of EGFP. (B–D) Cumulative distribution (left) and bar graphs (right) of recent fear conditioning memory (measured as freezing) as a function of entorhinal injections of AAVs expressing the Syt1 KD or tetanus-toxin light chain (TetTox). The experimental procedure was the same as that described in Fig4A. Data in bar graphs are means ± SEMs; numbers inside bars indicate the number of mice analyzed. Statistical significance between cumulative distributions was calculated by the Kolmogorov–Smirnov test (two-sample), and between groups (comparing Syt1 KD or TetTox to control) Student’s t test (2-tailed); * p<0.05; *** p<0.001.
Figure 6
Figure 6. Prefrontal Syt1 KD abrogates synchronous synaptic transmission
(A) Schematic diagram (left) and documentation of complete neuronal coverage of AAV-mediated gene expression in the prefrontal cortex (right). The green area in the schematic diagram indicates the distribution of AAV infection (ACC: anterior cingulate cortex; PL: prelimbic cortex; IL, infralimbic cortex; HP, hippocampus). The right panel depicts a representative coronal section of the anterior cingulate cortex (green, EGFP; red, DAPI counterstain). (B) Analysis of the extent of EGFP transport from the medial PFC to other brain areas ~30 days after stereotactic injection of AAVs. An anatomical reference map is depicted on the left, and fluorescence images of coronal brain sections from the same mouse at different anterior-posterior positions are shown on the right with two exposure times (25 ms and 1.5 s; green, EGFP; red, DAPI counterstain). The short exposure detects only EGFP-positive soma, showing their restriction to the prefrontal cortex (a high density of axons in the dorsal striatum is also visible); the long exposure documents the distribution of EGFP-positive axon projections (ACB, nucleus accumbens; BLA, basolateral nucleus of amygdala; CLA, claustrum; CP, caudate putamen; CTX, cortex; MD, mediodorsal nucleus of thalamus; RE, nucleus reunions; RSP, retrosplenial area; ZI, zona incerta). (C) Input/output curves of excitatory synaptic transmission in the PFC. Representative traces and quantitation of NMDA-receptor mediated EPSCs recorded in acute PFC slices from mice injected with control or Syt1 KD AAV were shown. Whole-cell recordings were obtained in layer2/3 pyramidal neurons; isolated single pulse stimuli were delivered to fibers distributed in layer 1. EPSCs were elicited with increasing stimulus strength (control, n=7; Syt1 KD, n=11). (D, E) Representative traces and quantitation of NMDA receptor-mediated EPSCs in acute PFC slices showing increased facilitation in response to stimulus trains in Syt1 KD. EPSCs were elicited by trains of stimuli at 10 Hz (E) or 50 Hz (F); dots on top of the traces indicate the time points of stimulation, the charge transfer during pulse 1 is colored black, and the charge transfer during subsequent pulses gray. The bottom traces in F depict expansions of the top traces to illustrate the EPSC kinetics. Facilitation (the pulse 2–10/pulse 1 or pulse 2–5/pulse 1 ratio) was calculated as the ratio of the charge transfer induced by the indicated pulses (right bar diagram). Since prefrontal neurons receive excitatory inputs from various brain regions besides the infected prefrontal neurons, the impact of TetTox or of the Syt1 KD on synaptic transmission is likely underestimated (control, n=8; Syt1 KD, n=11). Data are means ± SEM; numbers inside or on top of columns indicate number of neurons analyzed. Statistical significance between groups (comparing Syt1 KD or TetTox to control) was determined with student’s T-test (*** p<0.001). For more information on prefrontal infection, see Figure S4.
Figure 7
Figure 7. Prefrontal Syt1 KD blocks remote memories similarly to prefrontal TeTox expression
(A–C) Cumulative distribution (left) and bar graphs (right) of recent fear conditioning memory as a function of prefrontal injections of AAVs expressing the Syt1 KD or TetTox. (D–F) Same as A–C, except that the experimental design targeted remote memories. Data in the bar graphs are presented as mean ± SEM. The numbers inside the columns indicate the number of mice analyzed. Statistical significance between two groups was calculated by Student’s t test (2-tailed). Statistical significance between cumulative distributions was calculated with Kolmogorov–Smirnov test (two-sample). * P<0.05; ** P<0.01; *** P<0.001. For analysis of basic behavioral and motor parameters, see Figure S5.

Comment in

Similar articles

Cited by

References

    1. Ahmed OJ, Mehta MR. The hippocampal rate code: anatomy, physiology and theory. Trends Neurosci. 2009;32:329–338. - PMC - PubMed
    1. Aimone JB, Deng W, Gage FH. Resolving new memories: a critical look at the dentate gyrus, adult neurogenesis, and pattern separation. Neuron. 2011;70(4):589–596. - PMC - PubMed
    1. Borst JG. The low synaptic release probability in vivo. Trends Neurosci. 2010;33:259–266. - PubMed
    1. Branco T, Staras K. The probability of neurotransmitter release: variability and feedback control at single synapses. Nat Rev Neurosci. 2009;10:373–383. - PubMed
    1. Britton JC, Lissek S, Grillon C, Norcross MA, Pine DS. Development of anxiety: the role of threat appraisal and fear learning. Depress Anxiety. 2011;28:5–17. - PMC - PubMed

Publication types

MeSH terms

Substances

LinkOut - more resources