. 2012 Apr 27;287(18):14803-15.
doi: 10.1074/jbc.M111.297861. Epub 2012 Mar 7.

Intracellular modulation of signaling pathways by annexin A6 regulates terminal differentiation of chondrocytes

Affiliations

Intracellular modulation of signaling pathways by annexin A6 regulates terminal differentiation of chondrocytes

Takeshi Minashima et al. J Biol Chem. .

Abstract

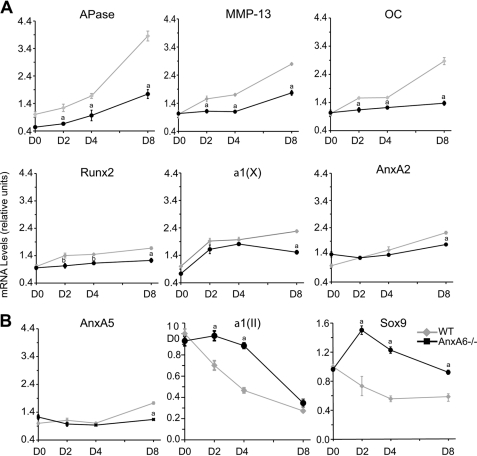
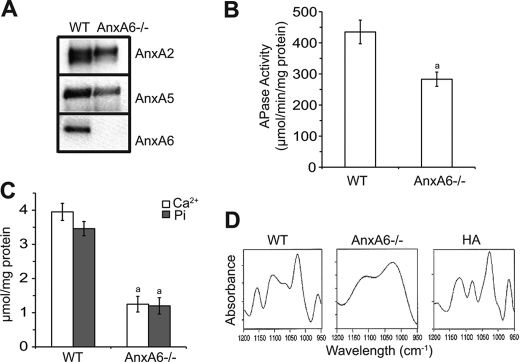
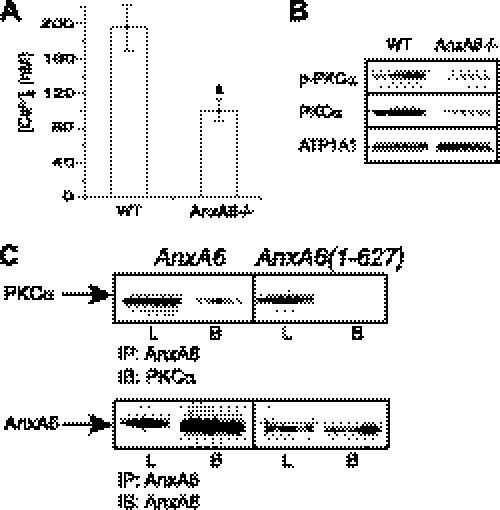
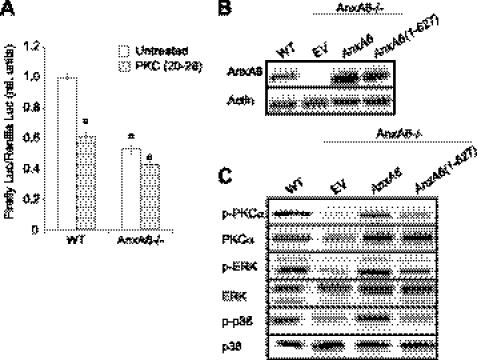
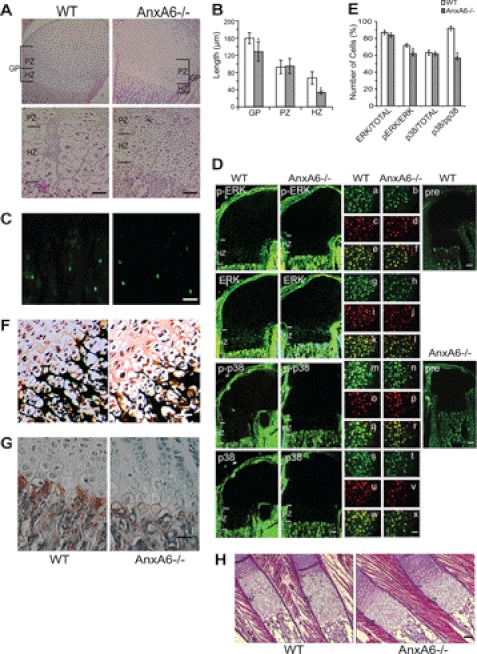
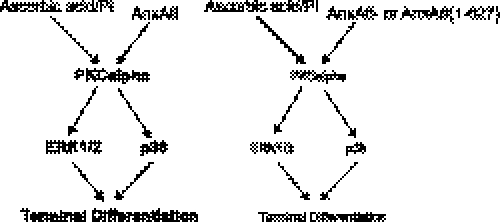
Annexin A6 (AnxA6) is highly expressed in hypertrophic and terminally differentiated growth plate chondrocytes. Rib chondrocytes isolated from newborn AnxA6-/- mice showed delayed terminal differentiation as indicated by reduced terminal differentiation markers, including alkaline phosphatase, matrix metalloproteases-13, osteocalcin, and runx2, and reduced mineralization. Lack of AnxA6 in chondrocytes led to a decreased intracellular Ca(2+) concentration and protein kinase C α (PKCα) activity, ultimately resulting in reduced extracellular signal-regulated kinase (ERK) and p38 mitogen-activated protein kinase (MAPK) activities. The 45 C-terminal amino acids of AnxA6 (AnxA6(1-627)) were responsible for the direct binding of AnxA6 to PKCα. Consequently, transfection of AnxA6-/- chondrocytes with full-length AnxA6 rescued the reduced expression of terminal differentiation markers, whereas transfection of AnxA6-/- chondrocytes with AnxA6(1-627) did not or only partially rescued the decreased mRNA levels of terminal differentiation markers. In addition, lack of AnxA6 in matrix vesicles, which initiate the mineralization process in growth plate cartilage, resulted in reduced alkaline phosphatase activity and Ca(2+) and inorganic phosphate (P(i)) content and the inability to form hydroxyapatite-like crystals in vitro. Histological analysis of femoral, tibial, and rib growth plates from newborn mice revealed that the hypertrophic zone of growth plates from newborn AnxA6-/- mice was reduced in size. In addition, reduced mineralization was evident in the hypertrophic zone of AnxA6-/- growth plate cartilage, although apoptosis was not altered compared with wild type growth plates. In conclusion, AnxA6 via its stimulatory actions on PKCα and its role in mediating Ca(2+) flux across membranes regulates terminal differentiation and mineralization events of chondrocytes.


Figures

FIGURE 1.
FIGURE 1.
mRNA levels of hypertrophic and terminal differentiation markers, AnxA2, and AnxA5 (A) and Sox-9 and type II collagen (B) in wild type (WT) and AnxA6−/− chondrocytes during an 8-day culture period. The mRNA levels of hypertrophic (runx2 and type X collagen (α1(X)) and terminal differentiation (APase, MMP-13, and osteocalcin (OC)), AnxA2, and AnxA5 (A) and Sox-9 and type II collagen (α1(II)) (B) of rib chondrocytes isolated from newborn AnxA6−/− mice and WT littermates after 0, 2, 4, and 8 days (D0, D2, D4, and D8) of treatment with ascorbic acid and additional 1.5 mm Pi were determined by real time PCR and SYBR Green and normalized to 18 S RNA levels. The mRNA levels are expressed relative to the levels of wild type cells at day 0, which were set as 1. Data were obtained from triplicate PCRs using RNA from three different cultures, and values are presented as means ± S.D. (a, p < 0.01 versus WT; b, p < 0.05 versus WT).
FIGURE 2.
FIGURE 2.
APase activity and mineralization of WT and AnxA6−/− chondrocytes. A and B, phase micrographs of WT (A) and AnxA6−/− (B) chondrocytes cultured in the presence of ascorbic acid and additional 1.5 mm Pi for 5 days. Bar, 200 μm. C and D, WT (C) and AnxA6−/− (D) chondrocytes were stained for APase activity after a 5-day culture period. E, APase activity was measured in the lysates of WT and AnxA6−/− chondrocytes after a 5-day culture period using p-nitrophenyl phosphate and normalized to the total protein concentration. Data were obtained from four different experiments, and values are presented as means ± S.D. (a, p < 0.01 versus WT). F, after an 8-day culture of WT and AnxA6−/− chondrocytes in the presence of ascorbic acid and additional 1.5 mm Pi, cell cultures were stained with alizarin red S to determine the degree of mineralization. To quantify the alizarin red S stain, each dish was incubated with cetylpyridinium chloride for 1 h. The optical density of alizarin red S stain released into solution was measured at 570 nm, normalized to the total amount of protein, and expressed as relative units compared with the optical density per mg of protein of WT cells, which was set as 1. Data were obtained from four different experiments, and values are presented as means ± S.D. (a, p < 0.01 versus WT).
FIGURE 3.
FIGURE 3.
Isolation and characterization of MVs isolated from WT and AnxA6−/− chondrocyte cultures. MVs were isolated from WT and AnxA6−/− chondrocytes cultured for 8 days in the presence of ascorbic acid and additional 1.5 mm Pi. MVs were isolated from these cultures using enzymatic digestions and ultracentrifugation as described under “Experimental Procedures.” A, equal amounts of MV proteins (30 μg of total protein) were separated by SDS-PAGE and analyzed for the amounts of AnxA2, AnxA5, and AnxA6 by immunoblotting using antibodies specific for AnxA2, AnxA5, and AnxA6. B, APase activity in MV fractions was determined using p-nitrophenyl phosphate as a substrate and normalized to the total amount of protein. C, amounts of Ca2+ and Pi in MV fractions were analyzed using colormetric assays as described under “Experiment Procedures” and normalized to the total amount of protein. B and C, data were obtained from three different vesicle preparations and are expressed as mean ± S.D. (a, p < 0.01 versus WT MVs). D, FTIR spectra of WT and AnxA6−/− MVs. Shown are second derivative spectra of the ν1ν3 phosphate region of WT and AnxA6−/− MVs incubated in synthetic cartilage lymph for 24 h at 37 °C and hydroxyapatite (HA). Note that in WT MVs bands can be seen at 960, 1,025, 1,065, 1,102, and 1,157 cm−1, whereas these bands are absent in AnxA6−/− MVs. Also note the similarity of the spectra of WT MVs and hydroxyapatite.
FIGURE 4.
FIGURE 4.
Intracellular Ca2+ concentration [Ca2+]i, phosphorylated and total PKCα levels in WT and AnxA6−/− chondrocytes, and co-immunoprecipitation of PKCα with antibodies specific for AnxA6. A, [Ca2+]i of WT and AnxA6−/− rib chondrocytes treated for 5 days with ascorbic acid and additional 1.5 mm Pi was measured using fura-2AM as described under “Experimental Procedures.” Data were obtained from three different experiments and are expressed as mean ± S.D. (a, p < 0.01 versus WT chondrocytes). B, the levels of plasma membrane-associated phosphorylated (p-PKCα) and total PKCα in WT chondrocytes and AnxA6−/− chondrocytes treated for 1 h with ascorbic acid and additional 1.5 mm Pi were determined by immunoblotting of plasma membrane fractions using antibodies specific for phosphorylated and total PKCα. ATP1A1 was used as a control to show equal loading. C, AnxA6−/− rib chondrocytes were transfected with empty pcDNA expression vector or pcDNA vector containing full-length AnxA6 or AnxA6(1–627). Three days after transfection, total cell extracts were co-immunoprecipitated with antibodies specific for AnxA6. The immunoprecipitates (IP) were then analyzed by immunoblotting (IB) with antibodies specific for total PKCα or AnxA6. L, total cell lysate; B, beads after immunoprecipitation.
FIGURE 5.
FIGURE 5.
ERK and p38 MAPK activities in WT and AnxA6−/− chondrocytes. Cell lysates from WT chondrocytes or AnxA6−/− chondrocytes cultured in the absence or presence of ascorbic acid and additional 1.5 mm Pi for different lengths of time (A) or from WT or AnxA6−/− chondrocytes cultured in the presence of ascorbic acid and additional 1.5 mm Pi and in the absence (Untreated) or presence of the PKCα-specific inhibitor PKC(20–28) for 1 h (B) were analyzed for ERK and p38 activities by immunoblotting cell lysates (30 μg of total protein) with antibodies specific for p-ERK and total ERK or p-p38 and total p38.
FIGURE 6.
FIGURE 6.
AnxA6 stimulates runx2 transcription activity via PKCα, and transfection with full-length AnxA6 but not AnxA6(1–627) rescues reduced PKCα, ERK, and p38 activities in AnxA6−/− chondrocytes. A, WT and AnxA6−/− chondrocytes were transfected with a firefly luciferase reporter construct containing six runx2 DNA-binding elements (pOSE2-Luc) and cultured in the presence of ascorbic acid and additional 1.5 mm Pi and in the absence (Untreated) or presence of PKC(20–28). After 48 h, the cells were lysed, and the lysates were analyzed for firefly luciferase (Luc) activity and normalized to Renilla luciferase activity as described under “Experimental Procedures.” rel., relative. Data were obtained from three different experiments and are expressed as mean ± S.D. Each experiment was performed in triplicate (a, p < 0.01 versus untreated WT chondrocytes). B, total cell extracts (30 μg of total protein) from WT chondrocytes and empty expression vector-transfected (EV) and expression vector containing full-length AnxA6 or AnxA6(1–627) cDNA-transfected AnxA6−/− chondrocytes treated with ascorbic acid and additional 1.5 mm Pi were subjected to SDS-PAGE and immunoblotting with antibodies specific for AnxA6 after 4-day transfection. β-Actin was used as a control to show equal loading. C, cell lysates from WT chondrocytes or AnxA6−/− chondrocytes transfected with empty expression vector (EV), full-length AnxA6, or AnxA6(1–627) cultured in the presence of ascorbic acid and additional 1.5 mm Pi for 1 h were analyzed for PKCα, ERK, and p38 activities by immunoblotting cell lysates (30 μg of total protein) with antibodies specific for phosphorylated PKCα (p-PKCα) and total PKCα, p-ERK and total ERK, or p-p38 and total p38.
FIGURE 7.
FIGURE 7.
Full-length AnxA6 but not AnxA6(1–627) rescues mRNA levels of APase, MMP-13, osteocalcin, and runx2. WT and AnxA6−/− chondrocytes transfected with empty expression vector (EV) or expression vector containing full-length AnxA6 cDNA or AnxA6(1–627) cDNA were cultured for 4 days in the presence of ascorbic acid and additional 1.5 mm Pi. APase, MMP-13, osteocalcin (OC), and runx2 mRNA levels of WT chondrocytes and AnxA6−/− chondrocytes transfected with the various expression vector constructs were detected by quantitative real time PCR using SYBR Green. Data were obtained from triplicate PCRs using RNA from three different cultures, and data are expressed as mean ± S.D. (a, p < 0.01 versus WT chondrocytes; b, p < 0.01 versus empty expression vector-transfected AnxA6−/− chondrocytes; c, p < 0.01 versus full-length AnxA6 expression vector-transfected AnxA6−/− chondrocytes).
FIGURE 8.
FIGURE 8.
Histological and histomorphometric analyses; evaluation of hypertrophic chondrocyte apoptosis and mineralization; and immunohistochemical analysis of APase, phosphorylated and total ERK, and p38 of the femoral epiphyseal and rib growth plate of newborn AnxA6−/− mice and WT littermates. A, hematoxylin- and eosin-stained sections of the femoral epiphyseal growth plate of a newborn AnxA6−/− mouse and WT littermate. Bar, 100 μm. B, histomorphometric analysis of the length of the total growth plate (GP), the proliferative zone (PZ), and the hypertrophic zone (HZ) of 10 newborn AnxA6−/− mice and 10 WT littermates. Data are expressed as mean ± S.D. (a, p < 0.01; b, p < 0.05 versus WT). C, TUNEL labeling of hypertrophic chondrocytes in the femoral epiphyseal growth plate of a newborn AnxA6−/− mouse and WT littermate. Bar, 100 μm. D, immunohistochemical analysis of femoral epiphyseal AnxA6−/− and WT growth plates was performed using antibodies against p-ERK and p-p38 MAPK and antibody against total ERK and p38 protein, respectively. In addition, immunostaining with non-immune IgG (pre) was performed as negative control staining. Bar, 100 μm. Panels a, c, e, g, i, k, m, o, q, s, u, and w, higher magnification of chondrocytes in the hypertrophic zone of WT growth plates immunostained with antibodies specific for p-ERK (panel a), total ERK (panel g), p-p38 (panel m), and total p38 (panel s) and counterstained with DAPI (panels c, i, o, and u). Merged images of p-ERK antibody- and DAPI-stained images (panel e), total ERK antibody- and DAPI-stained images (panel k), p-p38 antibody- and DAPI-stained images (panel q), and total p38 antibody- and DAPI-stained images (panel w) are shown. Panels b, d, f, h, j, l, n, p, r, t, v, and x, higher magnification of chondrocytes in the hypertrophic zone of AnxA6−/− growth plates immunostained with antibodies specific for p-ERK (panel b), total ERK (panel h), p-p38 (panel n), and total p38 (panel t) and counterstained with DAPI (panels d, j, p, and v). Merged images of p-ERK antibody- and DAPI-stained images (panel f), total ERK antibody- and DAPI-stained images (panel l), p-p38 antibody- and DAPI-stained images (panel r), and total p38 antibody- and DAPI-stained images (panel x) are shown. Bar, 100 μm. E, the number of total cells (DAPI-positive cells), cells immunopositive for total ERK or p38, and cells immunopositive for p-ERK or p-p38 in the hypertrophic zone of femoral epiphyseal AnxA6−/− and WT growth plates (n = 3) was counted and expressed as a percentage of total ERK- or p38-immunopositive cells per total cells, p-ERK-immunopositive cells per total ERK-immunopositive cells, or p-p38-immunopositive cells per total p38-immunopositive cells. F, von Kossa stained sections of the femoral epiphyseal growth plate of a newborn AnxA6−/− mouse and WT littermate. Bar, 100 μm. G, immunostaining of sections of the femoral epiphyseal growth plate of a newborn AnxA6−/− mouse and WT littermate with antibodies specific for APase. Bar, 100 μm. H, hematoxylin- and eosin-stained sections of the rib growth plates of a newborn AnxA6−/− mouse and WT littermate. Bar, 100 μm.
FIGURE 9.
FIGURE 9.
Scheme depicting possible role of AnxA6 in modulating (stimulating) ERK and p38 activities through direct binding of AnxA6 to PKCα and stimulating PKCα activity. Ascorbic acid and extracellular Pi activate PKCα and ultimately ERK and p38 MAPK signaling pathways. The AnxA6/PKCα interaction results in further stimulation of PKCα activity, increased ERK and p38 activity, and ultimately enhanced terminal differentiation events of chondrocytes. Lack of AnxA6 function (AnxA6−) or a truncated AnxA6 (AnxA6(1–627)), which has lost its ability to bind to PKCα, results in reduced activation of PKCα, ERK, and p38 and consequently leads to delayed terminal differentiation of chondrocytes treated with ascorbic acid and extracellular Pi.

Similar articles

Cited by

References

    1. Gerke V., Moss S. E. (2002) Annexins: from structure to function. Physiol. Rev. 82, 331–371 - PubMed
    1. Geisow M. J., Walker J. H., Boustead C., Taylor W. (1988) in Molecular Mechanisms in Secretion (Thorn N. A., Traiman M., Peterson O. H., eds) pp. 598–608, Munksgaard, Copenhagen
    1. Pfander D., Swoboda B., Kirsch T. (2001) Expression of early and late differentiation markers (proliferating cell nuclear antigen, syndecan-3, annexin VI, and alkaline phosphatase) by human osteoarthritic chondrocytes. Am. J. Pathol. 159, 1777–1783 - PMC - PubMed
    1. Lefebvre V., Smits P. (2005) Transcriptional control of chondrocyte fate and differentiation. Birth Defects Res. C Embryo Today 75, 200–212 - PubMed
    1. Shimo T., Koyama E., Sugito H., Wu C., Shimo S., Pacifici M. (2005) Retinoid signaling regulates CTGF expression in hypertrophic chondrocytes with differential involvement of MAP kinases. J. Bone Miner. Res. 20, 867–877 - PubMed

Publication types

MeSH terms