

Impact of intertumoral heterogeneity on predicting chemotherapy response of BRCA1-deficient mammary tumors
- PMID: 22396490
- PMCID: PMC3518318
- DOI: 10.1158/0008-5472.CAN-11-4201
Impact of intertumoral heterogeneity on predicting chemotherapy response of BRCA1-deficient mammary tumors
Abstract
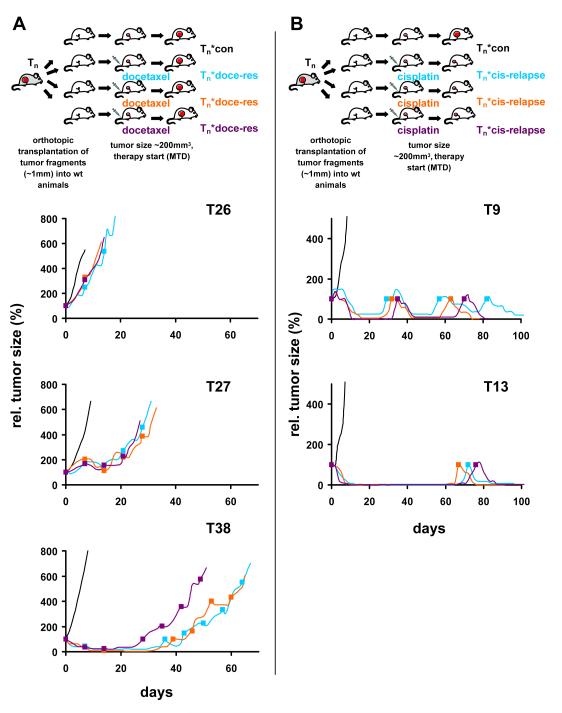
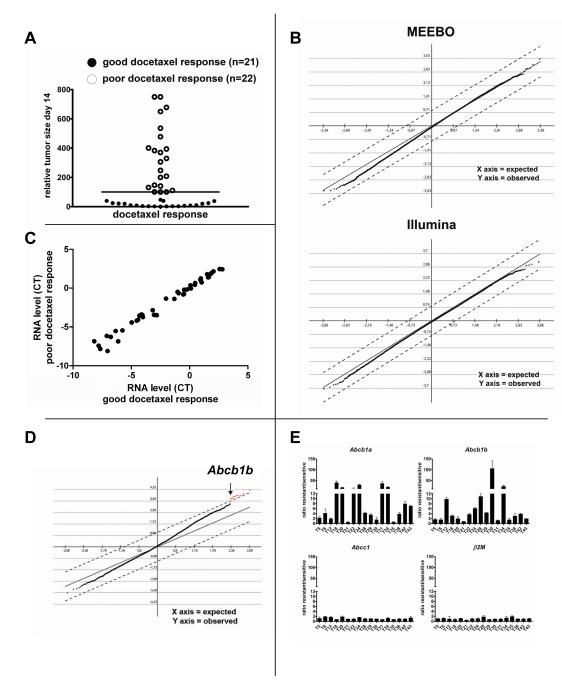
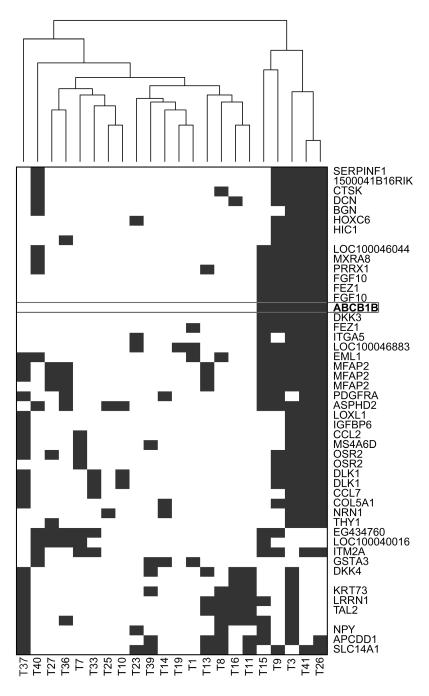
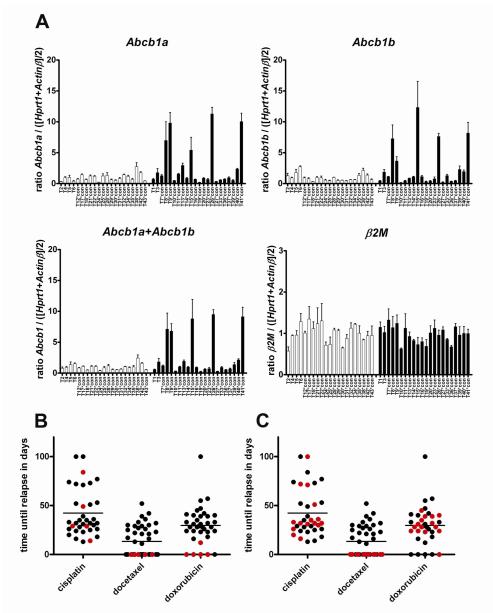
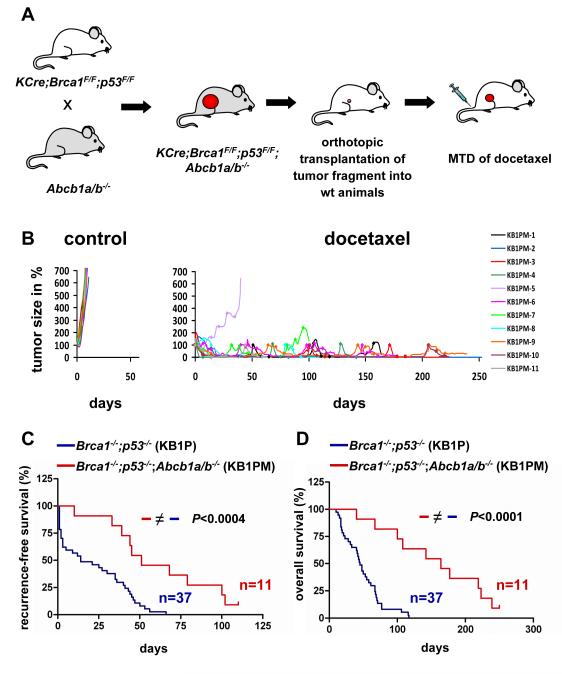
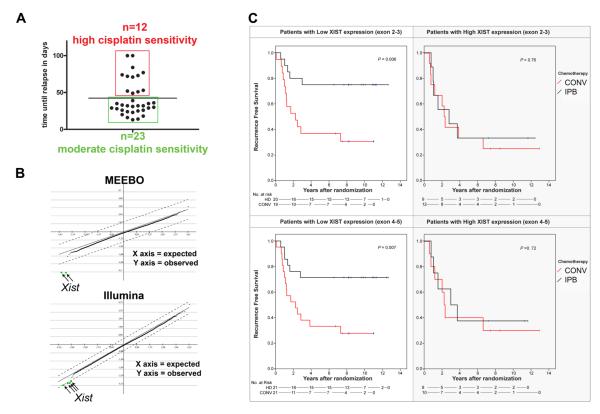
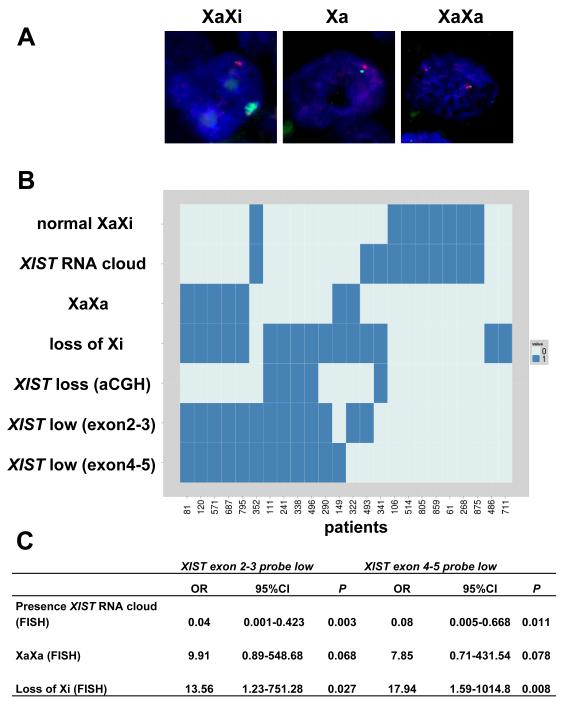
The lack of markers to predict chemotherapy responses in patients poses a major handicap in cancer treatment. We searched for gene expression patterns that correlate with docetaxel or cisplatin response in a mouse model for breast cancer associated with BRCA1 deficiency. Array-based expression profiling did not identify a single marker gene predicting docetaxel response, despite an increase in Abcb1 (P-glycoprotein) expression that was sufficient to explain resistance in several poor responders. Intertumoral heterogeneity explained the inability to identify a predictive gene expression signature for docetaxel. To address this problem, we used a novel algorithm designed to detect differential gene expression in a subgroup of the poor responders that could identify tumors with increased Abcb1 transcript levels. In contrast, standard analytical tools, such as significance analysis of microarrays, detected a marker only if it correlated with response in a substantial fraction of tumors. For example, low expression of the Xist gene correlated with cisplatin hypersensitivity in most tumors, and it also predicted long recurrence-free survival of HER2-negative, stage III breast cancer patients treated with intensive platinum-based chemotherapy. Our findings may prove useful for selecting patients with high-risk breast cancer who could benefit from platinum-based therapy.
©2012 AACR
Figures
Similar articles
-
EZH2 Is Overexpressed in BRCA1-like Breast Tumors and Predictive for Sensitivity to High-Dose Platinum-Based Chemotherapy.Clin Cancer Res. 2019 Jul 15;25(14):4351-4362. doi: 10.1158/1078-0432.CCR-18-4024. Epub 2019 Apr 29. Clin Cancer Res. 2019. PMID: 31036541
-
Abcc10 status affects mammary tumour growth, metastasis, and docetaxel treatment response.Br J Cancer. 2014 Aug 12;111(4):696-707. doi: 10.1038/bjc.2014.326. Epub 2014 Jun 17. Br J Cancer. 2014. PMID: 24937672 Free PMC article.
-
Selective induction of chemotherapy resistance of mammary tumors in a conditional mouse model for hereditary breast cancer.Proc Natl Acad Sci U S A. 2007 Jul 17;104(29):12117-22. doi: 10.1073/pnas.0702955104. Epub 2007 Jul 11. Proc Natl Acad Sci U S A. 2007. PMID: 17626183 Free PMC article.
-
Can the status of the breast and ovarian cancer susceptibility gene 1 product (BRCA1) predict response to taxane-based cancer therapy?Anticancer Agents Med Chem. 2009 Jun;9(5):543-9. doi: 10.2174/187152009788451798. Anticancer Agents Med Chem. 2009. PMID: 19519295 Free PMC article. Review.
-
A systematic review of genes involved in the inverse resistance relationship between cisplatin and paclitaxel chemotherapy: role of BRCA1.Curr Cancer Drug Targets. 2009 May;9(3):354-65. doi: 10.2174/156800909788166592. Curr Cancer Drug Targets. 2009. PMID: 19442054 Review.
Cited by
-
Temporal Heterogeneity of HER2 Expression and Spatial Heterogeneity of 18F-FDG Uptake Predicts Treatment Outcome of Pyrotinib in Patients with HER2-Positive Metastatic Breast Cancer.Cancers (Basel). 2022 Aug 17;14(16):3973. doi: 10.3390/cancers14163973. Cancers (Basel). 2022. PMID: 36010967 Free PMC article.
-
Increased levels of choline metabolites are an early marker of docetaxel treatment response in BRCA1-mutated mouse mammary tumors: an assessment by ex vivo proton magnetic resonance spectroscopy.J Transl Med. 2015 Apr 9;13:114. doi: 10.1186/s12967-015-0458-4. J Transl Med. 2015. PMID: 25890200 Free PMC article.
-
Ultrasound exposure improves the targeted therapy effects of galactosylated docetaxel nanoparticles on hepatocellular carcinoma xenografts.PLoS One. 2013;8(3):e58133. doi: 10.1371/journal.pone.0058133. Epub 2013 Mar 1. PLoS One. 2013. PMID: 23469265 Free PMC article.
-
Preventive evolutionary medicine of cancers.Evol Appl. 2013 Jan;6(1):134-43. doi: 10.1111/eva.12033. Epub 2012 Dec 5. Evol Appl. 2013. PMID: 23396860 Free PMC article.
-
The Lasker-Koshland Special Achievement Award in Medical Science awarded to Piet Borst.Proc Natl Acad Sci U S A. 2023 Sep 26;120(39):e2311130120. doi: 10.1073/pnas.2311130120. Epub 2023 Sep 21. Proc Natl Acad Sci U S A. 2023. PMID: 37732755 Free PMC article.
References
-
- McGuire WL. Steroid hormone receptors in breast cancer treatment strategy. Recent Prog Horm Res. 1980;36:135–56. - PubMed
-
- Slamon DJ, Leyland-Jones B, Shak S, Fuchs H, Paton V, Bajamonde A, et al. Use of chemotherapy plus a monoclonal antibody against HER2 for metastatic breast cancer that overexpresses HER2. N Engl J Med. 2001;344(11):783–92. - PubMed
-
- Tutt A, Robson M, Garber JE, Domchek SM, Audeh MW, Weitzel JN, et al. Oral poly(ADP-ribose) polymerase inhibitor olaparib in patients with BRCA1 or BRCA2 mutations and advanced breast cancer: a proof-of-concept trial. Lancet. 2010;376(9737):235–44. - PubMed
-
- Gorre ME, Mohammed M, Ellwood K, Hsu N, Paquette R, Rao PN, et al. Clinical resistance to STI-571 cancer therapy caused by BCR-ABL gene mutation or amplification. Science. 2001;293(5531):876–80. - PubMed
Publication types
MeSH terms
Substances
Grants and funding
LinkOut - more resources
Full Text Sources
Other Literature Sources
Medical
Molecular Biology Databases
Research Materials
Miscellaneous
