. 2012 Mar 1;26(5):474-89.
doi: 10.1101/gad.181933.111.

The MuvB complex sequentially recruits B-Myb and FoxM1 to promote mitotic gene expression

Affiliations

The MuvB complex sequentially recruits B-Myb and FoxM1 to promote mitotic gene expression

Subhashini Sadasivam et al. Genes Dev. .

Abstract

Cell cycle progression is dependent on two major waves of gene expression. Early cell cycle gene expression occurs during G1/S to generate factors required for DNA replication, while late cell cycle gene expression begins during G2 to prepare for mitosis. Here we demonstrate that the MuvB complex-comprised of LIN9, LIN37, LIN52, LIN54, and RBBP4-serves an essential role in three distinct transcription complexes to regulate cell cycle gene expression. The MuvB complex, together with the Rb-like protein p130, E2F4, and DP1, forms the DREAM complex during quiescence and represses expression of both early and late genes. Upon cell cycle entry, the MuvB complex dissociates from p130/DREAM, binds to B-Myb, and reassociates with the promoters of late genes during S phase. MuvB and B-Myb are required for the subsequent recruitment of FoxM1 to late gene promoters during G2. The MuvB complex remains bound to FoxM1 during peak late cell cycle gene expression, while B-Myb binding is lost when it undergoes phosphorylation-dependent, proteasome-mediated degradation during late S phase. Our results reveal a novel role for the MuvB complex in recruiting B-Myb and FoxM1 to promote late cell cycle gene expression and in regulating cell cycle gene expression from quiescence through mitosis.


Figures

Figure 1.
Figure 1.
The switch from DREAM to B-Myb–MuvB is accompanied by dynamic changes in the promoter occupancies of these complexes on DREAM target promoters. (A) Lysates from IMR-90 cells in serum-starved quiescence (G0), or released from G0 by serum readdition and blocked in early S phase with aphidicolin (24 h treatment, B) and released from the aphidicolin block for 5 and 10.5 h (R5 and R10.5) were immunoprecipitated with antibodies to LIN9 followed by Western blot. (*) Nonspecific band. (B) Lysates prepared from HeLa cells blocked in early S phase by double thymidine block (0) and then released from the block for the indicated times (2, 5, 6, 7, and 8 h) were immunoprecipitated with antibodies to B-Myb and LIN9 followed by Western blot. (C) Lysates from T98G cells in serum-starved quiescence (G0) and 10 or 18 h after serum addition (S10 and S18) were immunoprecipitated with antibodies to LIN9 and B-Myb followed by Western blot. (*) Nonspecific band. (DF) Chromatin from cells as in C was immunoprecipitated with antibodies to E2F4, LIN9, and B-Myb. Differential site occupancy on DREAM target promoters indicated in the X-axis across G0, G1/S, and S was normalized to G0 values. Average values and SD (standard deviation) from three biological replicates are shown.
Figure 2.
Figure 2.
Genome-wide in vivo binding sites of LIN9 and B-Myb overlap significantly and are highly enriched in promoters of mitotic genes. (A) Venn diagram showing the overlap between significant peaks (FDR < 0.1) for LIN9 and B-Myb binding, with size and overlap drawn to scale. Numbers indicate the number of binding sites (or peaks) for each factor. LIN9 is shown in light blue, B-Myb is in green, and the overlap is in yellow. The color scheme of LIN9 in light blue and B-Myb in green is preserved throughout the rest of the figures. (B) Rank correlation plot of sites bound by B-Myb and LIN9. Sites bound by both factors are shown as black circles, sites bound by LIN9 only are shown in blue, and sites bound by B-Myb only are shown in green. The rs value represents the Spearman's rank correlation coefficient of the overlapping sites. (C) Location of regions bound by B-Myb and LIN9 relative to the TSS. 0 indicates TSS, negative values indicate regions upstream of the TSS, and positive values indicate regions downstream from the TSS. (D) Genes targeted by both B-Myb and LIN9 or uniquely targeted by any one factor were functionally annotated using DAVID gene ontologies, biological pathway (BP), and cellular component (CC). The top two functional clusters obtained using each of the three gene sets are indicated along with the P-values.
Figure 3.
Figure 3.
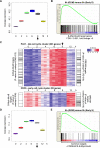
B-Myb–MuvB binds to a subset of DREAM targets expressed late in the cell cycle. (A) Box plot depicting the average expression of 278 B-Myb and LIN9 target genes, defined by FDR < 0.001 and fold change > 5, in HeLa cells after double thymidine block and release. Expression values of the 278 target genes derived from microarray analysis of the 0-, 2-, 4-, 6-, 8-, and 12-h time points were averaged. The difference in the means of the three replicates for each time point is displayed as a box plot. (B) GSEA was used to test whether the 278 B-Myb and LIN9 target genes (same as in A) were randomly distributed or tended to occur toward the extremes of the list of genes differentially expressed between 6 and 0 h after double thymidine block and release. The enrichment score of 0.6 reflects the degree to which these B-Myb and LIN9 target genes are overrepresented at the extreme top of the entire ranked list of genes differentially expressed between the 6- and 0-h time points. (C) Heat maps depicting the expression of a cluster of genes with an expression pattern similar to PLK1 (late cell cycle cluster) or CDC6 (early cell cycle cluster) at different times after double thymidine block and release. Genes in the clusters that were targets of DREAM (Litovchick et al. 2007) or B-Myb–MuvB (this study) are indexed by black lines on either side of the heat map. P-values of overlaps (Fisher's exact test) are also indicated. (D) Box plot depicting the average expression of 92 genes that are common targets of DREAM and B-Myb–MuvB. The analysis description is the same as in A. (E) GSEA plot comparing the expression of 92 target genes common to DREAM and B-Myb–MuvB at the 6- and 0-h time points. The analysis description is the same as in B. Arrows in A, C, and D indicate when mitosis was observed.
Figure 4.
Figure 4.
B-Myb and LIN54 are both required for the B-Myb–MuvB complex to bind to the PLK1 promoter. (A) RNA isolated from untransfected (U), control (siCon), and LIN9, LIN54, or B-Myb siRNA transfected HeLa cells was analyzed by RT-qPCR with specific primers for genes indicated in the X-axis. The fold change was calculated relative to GAPDH mRNA levels and plotted with respect to the value for the untransfected sample, which was taken as 1. (B) HeLa cells were transfected with the indicated siRNAs to B-Myb and MuvB or control siRNA (Con) or left untransfected (U). The expression of B-Myb, LIN54, LIN9, and Vinculin (loading control) in whole-cell lysates was detected by Western blot. (C) Lysates from untransfected (U), control (Con), or LIN54 siRNA transfected HeLa cells were immunoprecipitated with LIN9 antibody. Protein levels of the MuvB proteins and B-Myb were assayed by Western blots. (D) Chromatin from HeLa cells transfected with control siRNA (siCon), B-Myb siRNA (siB-Myb), or LIN54 siRNA (siLIN54) was immunoprecipitated with antibodies to LIN9, LIN54, B-Myb, and Histone H3. ChIP enrichment of the PLK1 promoter was calculated relative to siCon. ChIP for H3 was used as a control to compare ChIP efficiencies between the two sets of chromatin. Average values and SD from three experimental data points are shown.
Figure 5.
Figure 5.
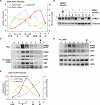
B-Myb phosphorylation at the end of S phase correlates with the start of target gene expression. (A) Chromatin and RNA from HeLa cells synchronized by double thymidine block and released for the indicated times were collected. Chromatin was used for ChIP with B-Myb and LIN54 antibodies to determine the enrichment of the PLK1 promoter at different time points. RNA was used to determine the level of expression of PLK1 relative to GAPDH. Average values and SD from three experimental data points are shown. (B) Lysates prepared from HeLa cells treated with DMSO or Velcade (1 μM) 2 h after release from double thymidine block and allowed to progress for 6 h (i.e., 8 h after release from the block) were Western-blotted with the indicated antibodies. (*) Nonspecific band. (C) Lysates from HeLa cells at several intervals after double thymidine block and release were Western-blotted or immunoprecipitated with a phospho-specific antibody to B-Myb that recognized pT487. Western blots of the pT487 IP were used to detect the presence of coprecipitated B-Myb and MuvB. (D) Lysates from HeLa cells at several intervals after double thymidine block and release were immunoprecipitated with LIN54 antibody and Western-blotted to detect pT487 B-Myb and the rest of the MuvB core proteins. (E) Chromatin from HeLa cells after double thymidine block and release was used for ChIP with total B-Myb and phospho-specific pT487 B-Myb antibodies to determine the enrichment of the PLK1 promoter. RNA collected at the same intervals was assayed to determine the level of expression of PLK1 relative to GAPDH. Average values and SD from three experimental data points are shown. Arrows indicate when mitosis was observed.
Figure 6.
Figure 6.
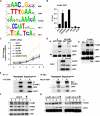
FoxM1 is required for late cell cycle gene expression and binds to MuvB during G2 and mitosis. (A) De novo motif discovery identifies consensus sequences for Myb, CHR, FoxM1, NF-Y, and AP-1 as significantly enriched in genomic regions targeted by B-Myb and LIN9. Web logos representing motifs that were derived from B-Myb- or LIN9-bound genomic regions are shown. (B) Chromatin from asynchronous HeLa cells was used for ChIP with FoxM1 antibody followed by qPCR to amplify promoter regions of a panel of cell cycle genes indicated in the X-axis. Enrichments were calculated as percentage of the total input chromatin. Average values and SD from three experimental data points are shown. (C) RNA was isolated from siRNA transfected HeLa cells blocked in thymidine and released for different times (0, 2, 4, 6 and 8 h) and was analyzed by RT-qPCR with primers specific for CCNB1. The fold change was calculated relative to GAPDH mRNA levels. Average values and SD from three experimental data points are shown. (D) Lysates from untransfected (U) or FoxM1 siRNA (siFoxM1) transfected HeLa cells were immunoprecipitated with antibodies to FoxM1 and rabbit IgG (IgG). The presence of LIN9 and LIN37 was assayed by Western blot. The bottom panel shows protein levels of FoxM1, LIN37 and LIN9 in the lysates that were used for IP. (Right panel) Lysates from asynchronously growing HeLa cells were immunoprecipitated with two different antibodies to FoxM1 (Ab-1 and Ab-2) and rabbit IgG (IgG). The presence of FoxM1, LIN9, LIN37, and LIN52 was assayed by Western blot. (*) Antibody chains. (E) T7-FoxM1 or Myc-FoxM1 transfected cells (+) or untransfected cells (−) were left untreated (Asynchronous) or, 48 h later, were treated with nocodazole at a concentration of 1μg/mL for 18 h. Lysates from these cells were used for IP with T7 tag or Myc tag antibody-conjugated agarose beads. Protein levels of T7-FoxM1, Myc-FoxM1, LIN9, and LIN37 were assayed by Western blots. (*) IgG heavy chain. (F,G) Lysates from HeLa cells at several intervals after double thymidine block and release were immunoprecipitated with the LIN9 antibody (F) and two different FoxM1 antibodies (G) and were Western-blotted to detect FoxM1, B-Myb, and the MuvB proteins LIN9 or LIN37. (*) IgG light chain. Arrows in the panels indicate when mitosis was observed.
Figure 7.
Figure 7.
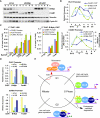
MuvB and B-Myb recruit FoxM1 to cooperatively activate late cell cycle gene expression. (A) Whole-cell lysates were isolated from siRNA transfected HeLa cells blocked in thymidine and released for different times (0, 2, 4, 6, and 8 h) and were Western-blotted with the indicated antibodies. Vinculin was used as a loading control. (B) Chromatin from HeLa cells after double thymidine block and release was used for ChIP with B-Myb, LIN9, and FoxM1 antibodies. ChIP DNA was used to amplify a region from the promoter of PLK1 (top) and CCNB1 (bottom). Average values and SD from three experimental data points are shown. (C) Chromatin from asynchronously growing HeLa cells was used to immunoprecipitate LIN9 or pT487 B-Myb. Immunoprecipitated chromatin was used for reChIP with either no antibody (control) or antibodies to B-Myb, pT487 B-Myb, LIN54, and FoxM1. Average values and SD from three biological replicates are shown. The enrichment values are expressed as a percentage of the first ChIP (LIN9 or pT487 B-Myb). (D) Chromatin from HeLa cells transfected with control siRNA (siCon), B-Myb siRNA (siB-Myb), LIN9 siRNA (siLIN9), or FoxM1 siRNA (siFoxM1) was immunoprecipitated with antibodies to B-Myb and FoxM1. ChIP enrichments of the PLK1 and CCNB1 promoters were calculated relative to siCon. Average values and SD from three experimental data points are shown. (E) Schematic of our proposed model illustrating an essential role for the MuvB complex in regulating cell cycle gene expression from quiescence into mitosis.

Similar articles

Cited by

References

    1. Abdurashidova G, Riva S, Biamonti G, Giacca M, Falaschi A 1998. Cell cycle modulation of protein-DNA interactions at a human replication origin. EMBO J 17: 2961–2969 - PMC - PubMed
    1. Andrejka L, Wen H, Ashton J, Grant M, Iori K, Wang A, Manak JR, Lipsick JS 2011. Animal-specific C-terminal domain links myeloblastosis oncoprotein (Myb) to an ancient repressor complex. Proc Natl Acad Sci 108: 17438–17443 - PMC - PubMed
    1. Blais A, Dynlacht BD 2007. E2F-associated chromatin modifiers and cell cycle control. Curr Opin Cell Biol 19: 658–662 - PMC - PubMed
    1. Breeden LL 2003. Periodic transcription: a cycle within a cycle. Curr Biol 13: R31–R38 doi: 10.1016/S0960-9822(02)01386-6 - PubMed
    1. Caretti G, Salsi V, Vecchi C, Imbriano C, Mantovani R 2003. Dynamic recruitment of NF-Y and histone acetyltransferases on cell-cycle promoters. J Biol Chem 278: 30435–30440 - PubMed

Publication types

LinkOut - more resources