

Network biology methods integrating biological data for translational science
- PMID: 22390873
- PMCID: PMC3404396
- DOI: 10.1093/bib/bbr075
Network biology methods integrating biological data for translational science
Abstract
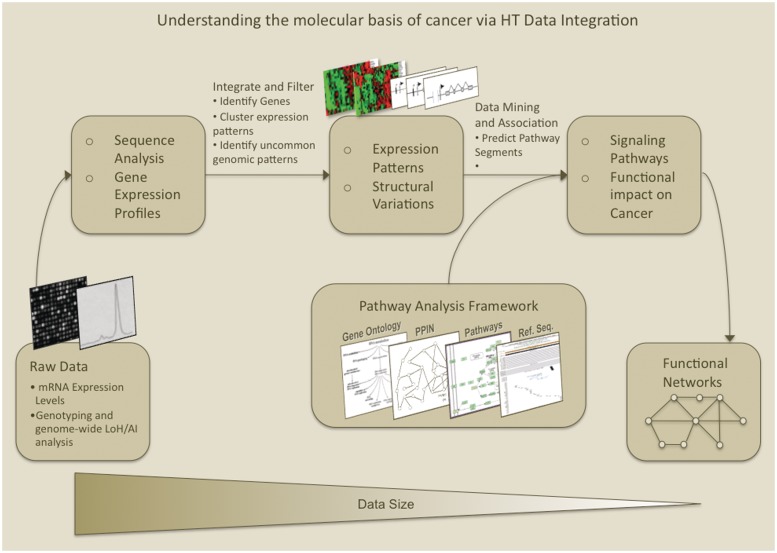
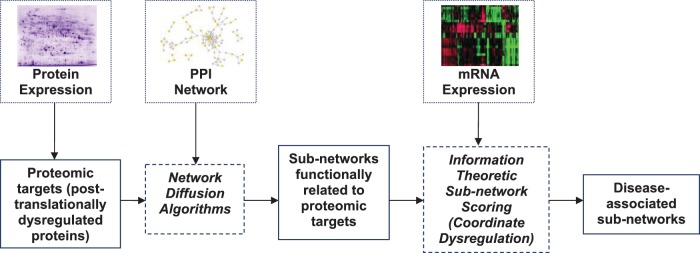
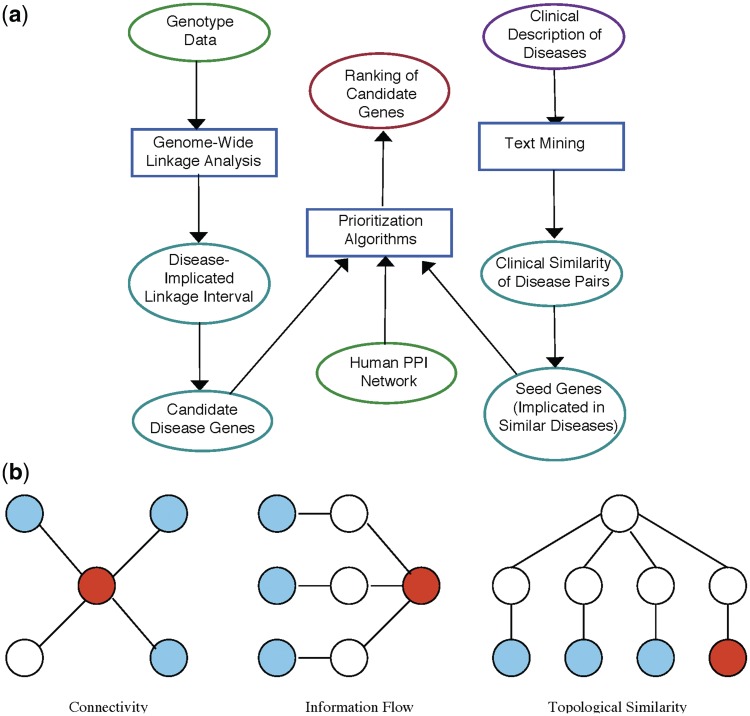
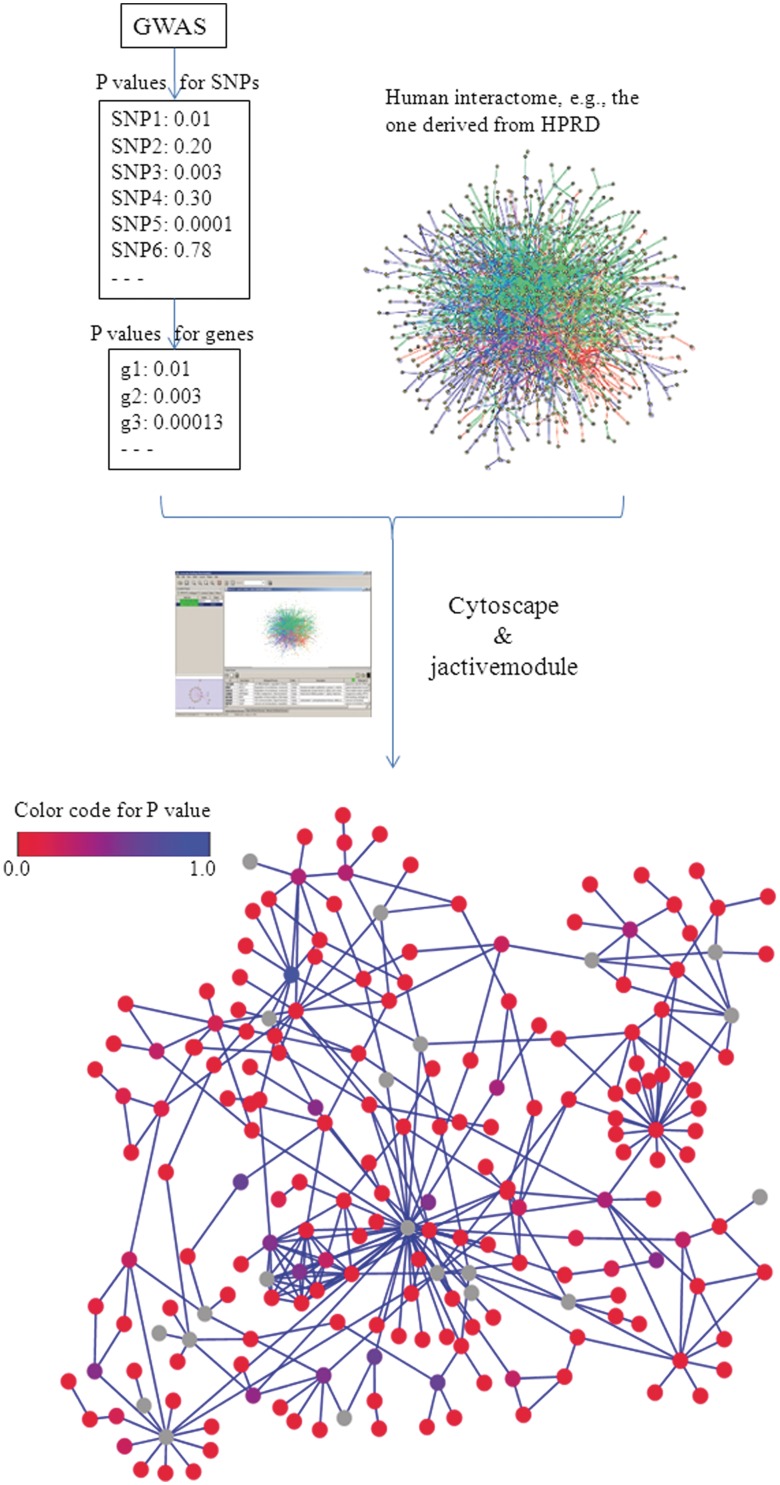
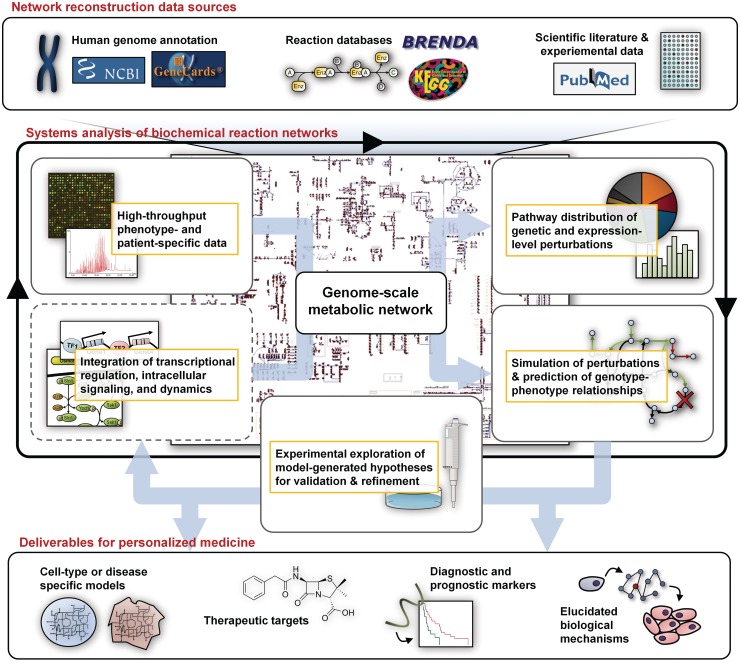
The explosion of biomedical data, both on the genomic and proteomic side as well as clinical data, will require complex integration and analysis to provide new molecular variables to better understand the molecular basis of phenotype. Currently, much data exist in silos and is not analyzed in frameworks where all data are brought to bear in the development of biomarkers and novel functional targets. This is beginning to change. Network biology approaches, which emphasize the interactions between genes, proteins and metabolites provide a framework for data integration such that genome, proteome, metabolome and other -omics data can be jointly analyzed to understand and predict disease phenotypes. In this review, recent advances in network biology approaches and results are identified. A common theme is the potential for network analysis to provide multiplexed and functionally connected biomarkers for analyzing the molecular basis of disease, thus changing our approaches to analyzing and modeling genome- and proteome-wide data.
Figures
Similar articles
-
Translational Metabolomics of Head Injury: Exploring Dysfunctional Cerebral Metabolism with Ex Vivo NMR Spectroscopy-Based Metabolite Quantification.In: Kobeissy FH, editor. Brain Neurotrauma: Molecular, Neuropsychological, and Rehabilitation Aspects. Boca Raton (FL): CRC Press/Taylor & Francis; 2015. Chapter 25. In: Kobeissy FH, editor. Brain Neurotrauma: Molecular, Neuropsychological, and Rehabilitation Aspects. Boca Raton (FL): CRC Press/Taylor & Francis; 2015. Chapter 25. PMID: 26269925 Free Books & Documents. Review.
-
An overview of technologies for MS-based proteomics-centric multi-omics.Expert Rev Proteomics. 2022 Mar;19(3):165-181. doi: 10.1080/14789450.2022.2070476. Epub 2022 May 2. Expert Rev Proteomics. 2022. PMID: 35466851 Free PMC article.
-
Genome and proteome annotation: organization, interpretation and integration.J R Soc Interface. 2009 Feb 6;6(31):129-47. doi: 10.1098/rsif.2008.0341. J R Soc Interface. 2009. PMID: 19019817 Free PMC article. Review.
-
Whole genome data for omics-based research on the self-fertilizing fish Kryptolebias marmoratus.Mar Pollut Bull. 2014 Aug 30;85(2):532-41. doi: 10.1016/j.marpolbul.2014.04.005. Epub 2014 Apr 20. Mar Pollut Bull. 2014. PMID: 24759509 Review.
-
The application of multi-omics and systems biology to identify therapeutic targets in chronic kidney disease.Nephrol Dial Transplant. 2016 Dec;31(12):2003-2011. doi: 10.1093/ndt/gfv364. Epub 2015 Oct 20. Nephrol Dial Transplant. 2016. PMID: 26487673 Review.
Cited by
-
Bipartite graphs in systems biology and medicine: a survey of methods and applications.Gigascience. 2018 Apr 1;7(4):1-31. doi: 10.1093/gigascience/giy014. Gigascience. 2018. PMID: 29648623 Free PMC article. Review.
-
Proteomics and Network Analyses Reveal Inhibition of Akt-mTOR Signaling in CD4+ T Cells by Mycobacterium tuberculosis Mannose-Capped Lipoarabinomannan.Proteomics. 2017 Nov;17(22):1700233. doi: 10.1002/pmic.201700233. Proteomics. 2017. PMID: 28994205 Free PMC article.
-
On fusion methods for knowledge discovery from multi-omics datasets.Comput Struct Biotechnol J. 2020 Mar 5;18:509-517. doi: 10.1016/j.csbj.2020.02.011. eCollection 2020. Comput Struct Biotechnol J. 2020. PMID: 32206210 Free PMC article. Review.
-
Methods for biological data integration: perspectives and challenges.J R Soc Interface. 2015 Nov 6;12(112):20150571. doi: 10.1098/rsif.2015.0571. J R Soc Interface. 2015. PMID: 26490630 Free PMC article. Review.
-
Omics databases on kidney disease: where they can be found and how to benefit from them.Clin Kidney J. 2016 Jun;9(3):343-52. doi: 10.1093/ckj/sfv155. Epub 2016 Mar 21. Clin Kidney J. 2016. PMID: 27274817 Free PMC article. Review.
References
-
- Fields S, Song O. A novel genetic system to detect protein-protein interactions. Nature. 1989;340(6230):245–6. - PubMed
-
- Gavin AC, Bosche M, Krause R, et al. Functional organization of the yeast proteome by systematic analysis of protein complexes. Nature. 2002;415(6868):141–7. - PubMed
-
- Hartman JLt, Garvik B, Hartwell L. Principles for the buffering of genetic variation. Science. 2001;291(5506):1001–4. - PubMed
-
- Ho Y, Gruhler A, Heilbut A, et al. Systematic identification of protein complexes in Saccharomyces cerevisiae by mass spectrometry. Nature. 2002;415(6868):180–3. - PubMed
Publication types
MeSH terms
Substances
Grants and funding
LinkOut - more resources
Full Text Sources
Other Literature Sources
