Differential gene and transcript expression analysis of RNA-seq experiments with TopHat and Cufflinks
- PMID: 22383036
- PMCID: PMC3334321
- DOI: 10.1038/nprot.2012.016
Differential gene and transcript expression analysis of RNA-seq experiments with TopHat and Cufflinks
Erratum in
- Nat Protoc. 2014 Oct;9(10):2513
Abstract
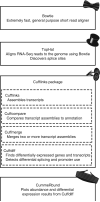
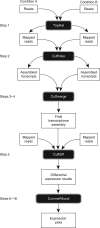
Recent advances in high-throughput cDNA sequencing (RNA-seq) can reveal new genes and splice variants and quantify expression genome-wide in a single assay. The volume and complexity of data from RNA-seq experiments necessitate scalable, fast and mathematically principled analysis software. TopHat and Cufflinks are free, open-source software tools for gene discovery and comprehensive expression analysis of high-throughput mRNA sequencing (RNA-seq) data. Together, they allow biologists to identify new genes and new splice variants of known ones, as well as compare gene and transcript expression under two or more conditions. This protocol describes in detail how to use TopHat and Cufflinks to perform such analyses. It also covers several accessory tools and utilities that aid in managing data, including CummeRbund, a tool for visualizing RNA-seq analysis results. Although the procedure assumes basic informatics skills, these tools assume little to no background with RNA-seq analysis and are meant for novices and experts alike. The protocol begins with raw sequencing reads and produces a transcriptome assembly, lists of differentially expressed and regulated genes and transcripts, and publication-quality visualizations of analysis results. The protocol's execution time depends on the volume of transcriptome sequencing data and available computing resources but takes less than 1 d of computer time for typical experiments and ∼1 h of hands-on time.
Figures



Similar articles
-
Analysis of RNA-Seq Data Using TopHat and Cufflinks.Methods Mol Biol. 2016;1374:339-61. doi: 10.1007/978-1-4939-3167-5_18. Methods Mol Biol. 2016. PMID: 26519415
-
Plant Transcriptome Analysis with HISAT-StringTie-Ballgown and TopHat-Cufflinks Pipelines.Methods Mol Biol. 2024;2812:203-213. doi: 10.1007/978-1-0716-3886-6_11. Methods Mol Biol. 2024. PMID: 39068364
-
Transcript-level expression analysis of RNA-seq experiments with HISAT, StringTie and Ballgown.Nat Protoc. 2016 Sep;11(9):1650-67. doi: 10.1038/nprot.2016.095. Epub 2016 Aug 11. Nat Protoc. 2016. PMID: 27560171 Free PMC article.
-
Protocol for transcriptome assembly by the TransBorrow algorithm.Biol Methods Protoc. 2023 Nov 1;8(1):bpad028. doi: 10.1093/biomethods/bpad028. eCollection 2023. Biol Methods Protoc. 2023. PMID: 38023349 Free PMC article. Review.
-
Computation for ChIP-seq and RNA-seq studies.Nat Methods. 2009 Nov;6(11 Suppl):S22-32. doi: 10.1038/nmeth.1371. Nat Methods. 2009. PMID: 19844228 Free PMC article. Review.
Cited by
-
Comparative transcriptomic analysis of thermally stressed Arabidopsis thaliana meiotic recombination mutants.BMC Genomics. 2021 Mar 12;22(1):181. doi: 10.1186/s12864-021-07497-2. BMC Genomics. 2021. PMID: 33711924 Free PMC article.
-
Long intervening non-coding RNA 00320 is human brain-specific and highly expressed in the cortical white matter.Neurogenetics. 2015 Jul;16(3):201-13. doi: 10.1007/s10048-015-0445-1. Epub 2015 Mar 29. Neurogenetics. 2015. PMID: 25819921
-
Longer Duration of Active Oil Biosynthesis during Seed Development Is Crucial for High Oil Yield-Lessons from Genome-Wide In Silico Mining and RNA-Seq Validation in Sesame.Plants (Basel). 2022 Nov 4;11(21):2980. doi: 10.3390/plants11212980. Plants (Basel). 2022. PMID: 36365434 Free PMC article.
-
VvHDZ28 positively regulate salicylic acid biosynthesis during seed abortion in Thompson Seedless.Plant Biotechnol J. 2021 Sep;19(9):1824-1838. doi: 10.1111/pbi.13596. Epub 2021 May 7. Plant Biotechnol J. 2021. PMID: 33835678 Free PMC article.
-
Mirror proteases of Ac-Trypsin and Ac-LysargiNase precisely improve novel event identifications in Mycolicibacterium smegmatis MC2 155 by proteogenomic analysis.Front Microbiol. 2022 Oct 12;13:1015140. doi: 10.3389/fmicb.2022.1015140. eCollection 2022. Front Microbiol. 2022. PMID: 36312923 Free PMC article.
References
-
- Mortazavi A, Williams BA, McCue K, Schaeffer L, Wold B. Mapping and quantifying mammalian transcriptomes by RNA-seq. Nat. Methods. 2008;5:621–628. - PubMed
-
- Cloonan N, et al. Stem cell transcriptome profiling via massive-scale mRNA sequencing. Nat. Methods. 2008;5:613–619. - PubMed
-
- Mardis ER. The impact of next-generation sequencing technology on genetics. Trends Genet. 2008;24:133–141. - PubMed
-
- Adams MD, et al. Sequence identification of 2,375 human brain genes. Nature. 1992;355:632–634. - PubMed
Publication types
MeSH terms
Substances
Grants and funding
LinkOut - more resources
Full Text Sources
Other Literature Sources
Molecular Biology Databases

