

Raf kinases mediate the phosphorylation of eukaryotic translation elongation factor 1A and regulate its stability in eukaryotic cells
- PMID: 22378069
- PMCID: PMC3317347
- DOI: 10.1038/cddis.2012.16
Raf kinases mediate the phosphorylation of eukaryotic translation elongation factor 1A and regulate its stability in eukaryotic cells
Erratum in
- Cell Death Dis. 2012;3:e317. Reinders, J [added]
Abstract
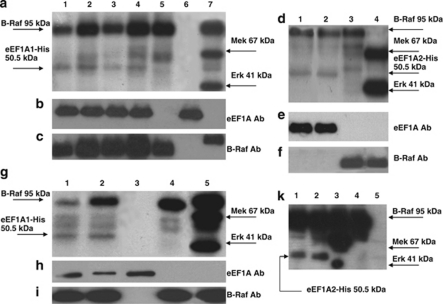
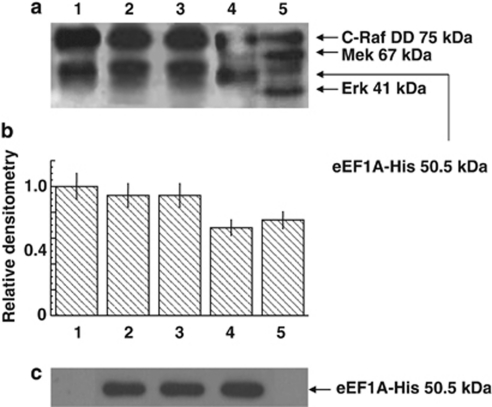
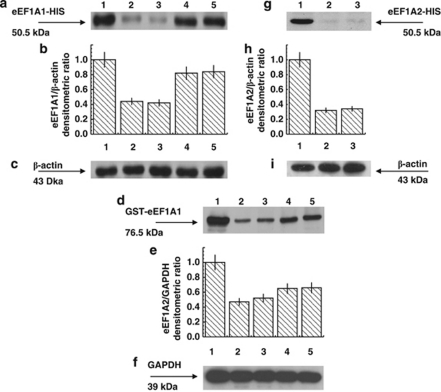
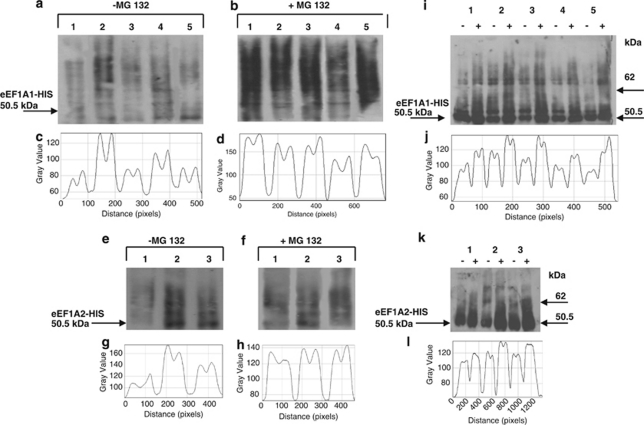
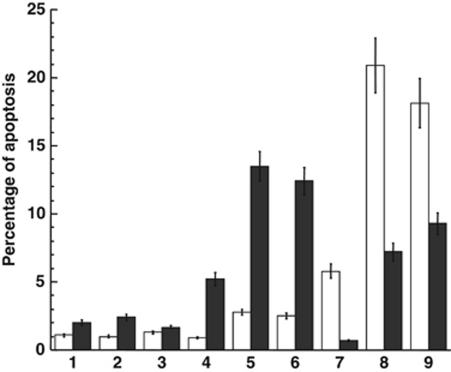
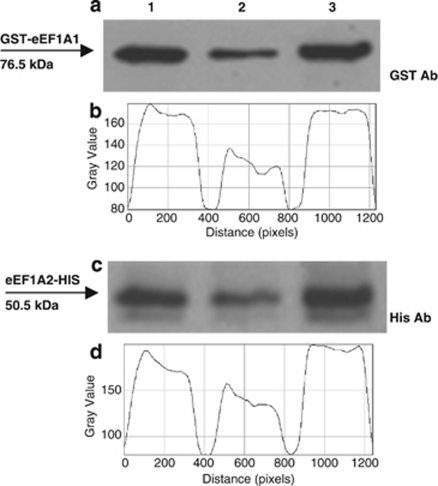
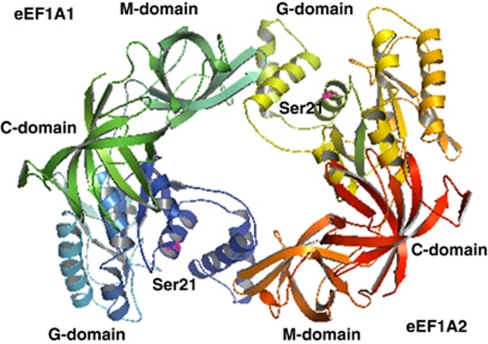
We identified eukaryotic translation elongation factor 1A (eEF1A) Raf-mediated phosphorylation sites and defined their role in the regulation of eEF1A half-life and of apoptosis of human cancer cells. Mass spectrometry identified in vitro S21 and T88 as phosphorylation sites mediated by B-Raf but not C-Raf on eEF1A1 whereas S21 was phosphorylated on eEF1A2 by both B- and C-Raf. Interestingly, S21 belongs to the first eEF1A GTP/GDP-binding consensus sequence. Phosphorylation of S21 was strongly enhanced when both eEF1A isoforms were preincubated prior the assay with C-Raf, suggesting that the eEF1A isoforms can heterodimerize thus increasing the accessibility of S21 to the phosphate. Overexpression of eEF1A1 in COS 7 cells confirmed the phosphorylation of T88 also in vivo. Compared with wt, in COS 7 cells overexpressed phosphodeficient (A) and phospho-mimicking (D) mutants of eEF1A1 (S21A/D and T88A/D) and of eEF1A2 (S21A/D), resulted less stable and more rapidly proteasome degraded. Transfection of S21 A/D eEF1A mutants in H1355 cells increased apoptosis in comparison with the wt isoforms. It indicates that the blockage of S21 interferes with or even supports C-Raf induced apoptosis rather than cell survival. Raf-mediated regulation of this site could be a crucial mechanism involved in the functional switching of eEF1A between its role in protein biosynthesis and its participation in other cellular processes.
Figures
Similar articles
-
New insights on the interaction between the isoforms 1 and 2 of human translation elongation factor 1A.Biochimie. 2015 Nov;118:1-7. doi: 10.1016/j.biochi.2015.07.021. Epub 2015 Jul 26. Biochimie. 2015. PMID: 26212729
-
A2 isoform of mammalian translation factor eEF1A displays increased tyrosine phosphorylation and ability to interact with different signalling molecules.Int J Biochem Cell Biol. 2008;40(1):63-71. doi: 10.1016/j.biocel.2007.08.014. Epub 2007 Sep 1. Int J Biochem Cell Biol. 2008. PMID: 17936057 Free PMC article.
-
Multiple molecular dynamics simulation of the isoforms of human translation elongation factor 1A reveals reversible fluctuations between "open" and "closed" conformations and suggests specific for eEF1A1 affinity for Ca2+-calmodulin.BMC Struct Biol. 2008 Jan 25;8:4. doi: 10.1186/1472-6807-8-4. BMC Struct Biol. 2008. PMID: 18221514 Free PMC article.
-
Raf kinases in signal transduction and interaction with translation machinery.Biomol Concepts. 2013 Aug;4(4):391-9. doi: 10.1515/bmc-2013-0003. Biomol Concepts. 2013. PMID: 25436588 Review.
-
Ser/Thr kinases and polyamines in the regulation of non-canonical functions of elongation factor 1A.Amino Acids. 2016 Oct;48(10):2339-52. doi: 10.1007/s00726-016-2311-3. Epub 2016 Aug 27. Amino Acids. 2016. PMID: 27568183 Review.
Cited by
-
Hepatitis B Virus DNA Polymerase Displays an Anti-Apoptotic Effect by Interacting with Elongation Factor-1 Alpha-2 in Hepatoma Cells.J Microbiol Biotechnol. 2021 Jan 28;31(1):16-24. doi: 10.4014/jmb.2002.02039. J Microbiol Biotechnol. 2021. PMID: 33144545 Free PMC article.
-
A web portal for exploring kinase-substrate interactions.NPJ Syst Biol Appl. 2024 Oct 3;10(1):113. doi: 10.1038/s41540-024-00442-5. NPJ Syst Biol Appl. 2024. PMID: 39362876 Free PMC article.
-
Saccharomyces cerevisiae Eukaryotic Elongation Factor 1A (eEF1A) Is Methylated at Lys-390 by a METTL21-Like Methyltransferase.PLoS One. 2015 Jun 26;10(6):e0131426. doi: 10.1371/journal.pone.0131426. eCollection 2015. PLoS One. 2015. PMID: 26115316 Free PMC article.
-
Overexpression of eukaryotic elongation factor 1 alpha-2 is associated with poorer prognosis in patients with gastric cancer.J Cancer Res Clin Oncol. 2015 Jul;141(7):1265-75. doi: 10.1007/s00432-014-1897-7. Epub 2015 Jan 20. J Cancer Res Clin Oncol. 2015. PMID: 25601347
-
Regulation of eukaryotic elongation factor 1 alpha (eEF1A) by dynamic lysine methylation.RNA Biol. 2018 Mar 4;15(3):314-319. doi: 10.1080/15476286.2018.1440875. Epub 2018 Mar 9. RNA Biol. 2018. PMID: 29447067 Free PMC article.
References
-
- Axelos M, Bardet C, Liboz T, Van Thai AL, Curie C, Lescure B. The gene family encoding the Arabidopsis thaliana translation elongation factor EF-1a: molecular cloning, characterization and expression. Mol Gen Genet. 1989;219:106–112. - PubMed
-
- Andersen GR, Nissen P, Nyborg J. Elongation factors in protein biosynthesis. Trends Biochem Sci. 2003;28:434–441. - PubMed
-
- Lund A, Knudsen SM, Vissing H, Clark B, Tommerup N. Assignment of human elongation factor 1alpha genes: EEF1A maps to chromosome 6q14 and EEF1A2 to 20q13.3. Genomics. 1996;36:359–361. - PubMed
-
- Stark H, Rodnina MV, Rinke-Appel J, Brimacombe R, Wintermey W, van Heel M. Visualization of the elongation factor Tu on the E. Coli Ribosome Nat. 1997;389:403–406. - PubMed
Publication types
MeSH terms
Substances
LinkOut - more resources
Full Text Sources
Research Materials
Miscellaneous
