Comparative Study
. 2012 Apr;122(4):1403-15.
doi: 10.1172/JCI46125. Epub 2012 Mar 1.

Evidence for a stepwise program of extrathymic T cell development within the human tonsil

Affiliations
Comparative Study

Evidence for a stepwise program of extrathymic T cell development within the human tonsil

Susan McClory et al. J Clin Invest. 2012 Apr.

Abstract

The development of a broad repertoire of T cells, which is essential for effective immune function, occurs in the thymus. Although some data suggest that T cell development can occur extrathymically, many researchers remain skeptical that extrathymic T cell development has an important role in generating the T cell repertoire in healthy individuals. However, it may be important in the setting of poor thymic function or congenital deficit and in the context of autoimmunity, cancer, or regenerative medicine. Here, we report evidence that a stepwise program of T cell development occurs within the human tonsil. We identified 5 tonsillar T cell developmental intermediates: (a) CD34⁺CD38dimLin⁻ cells, which resemble multipotent progenitors in the bone marrow and thymus; (b) more mature CD34⁺CD38brightLin⁻ cells; (c) CD34⁺CD1a⁺CD11c⁻ cells, which resemble committed T cell lineage precursors in the thymus; (d) CD34⁻CD1a⁺CD3⁻CD11c⁻ cells, which resemble CD4⁺CD8⁺ double-positive T cells in the thymus; and (e) CD34⁻CD1a⁺CD3⁺CD11c⁻ cells. The phenotype of each subset closely resembled that of its thymic counterpart. The last 4 populations expressed RAG1 and PTCRA, genes required for TCR rearrangement, and all 5 subsets were capable of ex vivo T cell differentiation. TdT⁺ cells found within the tonsillar fibrous scaffold expressed CD34 and/or CD1a, indicating that this distinct anatomic region contributes to pre-T cell development, as does the subcapsular region of the thymus. Thus, we provide evidence of a role for the human tonsil in a comprehensive program of extrathymic T cell development.


Figures

Figure 1
Figure 1. The human tonsil contains CD34+CD38dimLin, CD34+CD38brightLin, and CD34+CD1a+CD11c cells.
(A) Expression of CD34 and lineage markers (CD11c, BDCA-2, CD117, CD161, CD19, CD3, CD1a) on CD34-enriched tonsillar cells (left). Total lymphocytes were gated on Lin events and analyzed for their expression of CD34 and CD38 (right). The number above each gate indicates the mean percentage of CD34+ cells falling within that gate. (B) Expression of CD1a on CD34-enriched tonsillar cells (left). The number above each gate indicates the mean percentage of CD34+ cells falling within that gate. Events were gated on CD34+CD1a+ cells and analyzed for their coexpression of CD10 and CD11c (right). The number within the top left and bottom right quadrants represents the mean percentage of CD34+CD1a+ cells that are defined as either CD11c+ or CD10+, respectively. (C) The percentage of CD34+ cells that are defined as CD34+CD1a+CD11c in 4 representative human pediatric tonsils. Plots are gated on total CD34+ cells. Numbers in the bottom right quadrant indicate the percentage of CD34+ cells that are CD1a+CD11c in that particular donor. All data are from a representative tonsil of (A) 3, (B) 4, or (C) 24 individual donors.
Figure 2
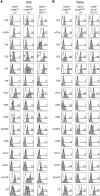
Figure 2. Phenotypic comparison of CD34+CD38dimLin, CD34+CD38brightLin, and CD34+CD1a+CD11c cells in human tonsil and thymus.
(A) Tonsillar cells were magnetically depleted of CD3- and CD19-expressing cells and were then enriched for CD34+ cells. Enriched cells are gated on CD34+CD38dimLin, CD34+CD38brightLin, or CD34+CD1a+CD11c events. (B) Thymic cells were magnetically enriched for CD34+ cells and then gated on the same 3 populations as in A. Gray shading indicates staining with the indicated antibody, whereas no shading indicates staining with an isotype-matched control antibody. The number above each gate indicates the percentage of events falling within that gate. Data in each histogram is from a representative donor, where n ≥ 3 for tonsil and n ≥ 2 for thymic data.
Figure 3
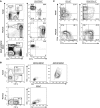
Figure 3. CD4+CD8+CD1a+ cells reside within the human tonsil.
(A) CD34-depleted cells from the human tonsil and thymus and total peripheral blood mononuclear cells were analyzed for expression of DP cells (left). DP events were then analyzed for expression of CD1a and CD3 (right). (B) CD19-depleted tonsillar cells were magnetically enriched for CD1a-expressing cells. CD34CD1a+CD11c and CD34CD1a+CD11c+ tonsillar cells were analyzed for their forward scatter (FSC) and side scatter (SSC) properties. CD34 thymic cells were analyzed for expression of CD1a and CD11c, and CD1a+ thymic cells were analyzed for forward and side scatter properties. (C) CD19-depleted tonsillar cells were simultaneously enriched for both CD34- and CD1a-expressing cells. Enriched cells were gated on CD11c (left) or CD34CD11c (right) events and analyzed for expression of CD34 and CD1a (left) and CD3 and CD1a (right). Thymic CD34+ and CD34 cells were similarly analyzed after CD34 enrichment. Data are representative of 1 out of at least 3 independent donors. Numbers within each gate represent the percentage of events falling within that gate for the representative donor shown.
Figure 4
Figure 4. Putative T cell precursors in the human tonsil acquire T-associated antigens in a fashion similar to that of those in the thymus.
(A) CD1a-enriched tonsillar cells were gated on CD3411c events and analyzed for the expression of antigens on 3 populations: CD1a+CD3, CD1a+CD3+, and CD1aCD3. (B) CD34-depleted thymic cells were gated on the same 3 populations and analyzed as in A. Gray shading indicates staining with the indicated antibody, whereas no shading indicates staining with an isotype-matched control antibody. The number listed above each gate indicates the percentage of events falling within that gate. Data in each histogram are from a representative donor, where n ≥ 3 for tonsil and n ≥ 2 for thymic data.
Figure 5
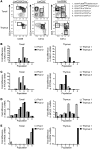
Figure 5. Quantification of gene expression in tonsillar precursor cells by real-time RT-PCR.
(A) Tonsillar cells were depleted of CD19+ cells, enriched for CD34+ and CD1a+ cells, and gated on the 6 populations shown. (BE) Expression of the genes RAG1, PTCRA, BCL2L1, and THPOK in 6 populations of human tonsillar and thymic cells. Cells were sorted from 8 tonsil donors, and 2 pools were generated for each population consisting of cells from 4 of the 8 donors (see Methods). Cells were sorted from 2 thymic donors. (BD) For analysis of RAG1, PTCRA, and BCL2L1, expression is displayed relative to that of population 2, which was arbitrarily set at 1. (E) For THPOK, expression is displayed relative to that of population 5 for the tonsil and population 6 for the thymus, each of which was arbitrarily set at 1.
Figure 6
Figure 6. CD1a+TdT+ cells reside near the fibrous scaffold of the human tonsil.
(A) Immunohistochemical staining of paraffin-embedded tonsillar sections shows TdT+ cells (dark brown) localized to the fibrous scaffold region. The image on the left (original magnification, ×50) is of a representative section, including a germinal center (GC), the surrounding interfollicular zone (IFZ), and an adjacent fibrous scaffold region (FS). The image on the right is of the same tonsil section, but at an original magnification of ×100. (B) Cells coexpressing TdT, CD1a, and CD34 are found within the scaffold region of the tonsil. TdT (green) and CD1a (red) coexpression is shown on the left, TdT (green) and CD34 (red) coexpression is shown in the middle, and CD34 (green) and CD1a (red) are shown on the right. Note the yellow cells in each section, which represent cells coexpressing both proteins of interest (yellow arrows). Blue staining indicates hematoxylin counterstain. (C) TdT (green), DL1 (red), and DL4 (red) proteins are expressed in the same geographical region of the human tonsil. Original magnification, ×400 (B and C).
Figure 7
Figure 7. T cell differentiation potential of putative extrathymic T cell precursors in the human tonsil.
(A and B) Cells were sorted from the human (A) tonsil or (B) thymus, as indicated in Figure 5A. All 6 populations were cultured independently on OP9-DL1 cells with FL and IL-7 for 26 days. After harvest, cells were analyzed for the expression of CD3, CD4, CD8, TCRαβ, and TCRγδ. Data are gated on GFPCD45+ events to exclude OP9-DL1 stromal cells from analysis. Data shown are representative of experiments performed with 7 individual tonsils or 4 thymus donors. Numbers represent the mean percentages of GFPCD45+ cells that stained positive for both antigens indicated on the dot plot.
Figure 8
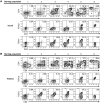
Figure 8. NK cell differentiation potential of putative extrathymic T cell precursors in the human tonsil.
(A) Tonsil and thymus cells were sorted as described in Figure 5A. Sorted cells were cultured on OP9-GFP cells and cultured with FL, KL, IL-3, IL-7, and IL-15 for 18 to 19 days. Harvested cells were gated on GFPCD45+ events and analyzed for expression of CD3 and CD56. (B and C) GFPCD45+ progeny from populations 1–4 were gated on CD3 events and analyzed for expression of CD56, CD161, NKp46, and CD5. CD3, CD56, CD161, and CD5 data are representative of independent experiments performed with 3 tonsil or 5 thymus donors. NKp46 data are representative of 2 experiments performed with tonsil donors or 3 experiments performed with thymic donors. No data (ND) are available for NKp46 or CD5 expression on progeny of thymic population 4 cells, due to the low numbers of harvested cells. All dot plots and gate frequencies are from a representative experiment. Numbers within each quadrant represent the percentage of events falling within that gate for the representative experiment shown.

Comment in

Similar articles

Cited by

References

    1. Blom B, Spits H. Development of human lymphoid cells. Annu Rev Immunol. 2006;24:287–320. doi: 10.1146/annurev.immunol.24.021605.090612. - DOI - PubMed
    1. Staal FJ, Weerkamp F, Langerak AW, Hendriks RW, Clevers HC. Transcriptional control of T lymphocyte differentiation. Stem Cells. 2001;19(3):165–179. doi: 10.1634/stemcells.19-3-165. - DOI - PubMed
    1. Dik WA, et al. New insights on human T cell development by quantitative T cell receptor gene rearrangement studies and gene expression profiling. . J Exp Med. 2005;201(11):1715–1723. doi: 10.1084/jem.20042524. - DOI - PMC - PubMed
    1. Klein F, et al. T lymphoid differentiation in human bone marrow. Proc Natl Acad Sci U S A. 2003;100(11):6747–6752. doi: 10.1073/pnas.1031503100. - DOI - PMC - PubMed
    1. Doulatov S, Notta F, Eppert K, Nguyen LT, Ohashi PS, Dick JE. Revised map of the human progenitor hierarchy shows the origin of macrophages and dendritic cells in early lymphoid development. Nat Immunol. 2010;11(7):585–593. doi: 10.1038/ni.1889. - DOI - PubMed

Publication types

MeSH terms