

Massively parallel functional dissection of mammalian enhancers in vivo
- PMID: 22371081
- PMCID: PMC3402344
- DOI: 10.1038/nbt.2136
Massively parallel functional dissection of mammalian enhancers in vivo
Abstract
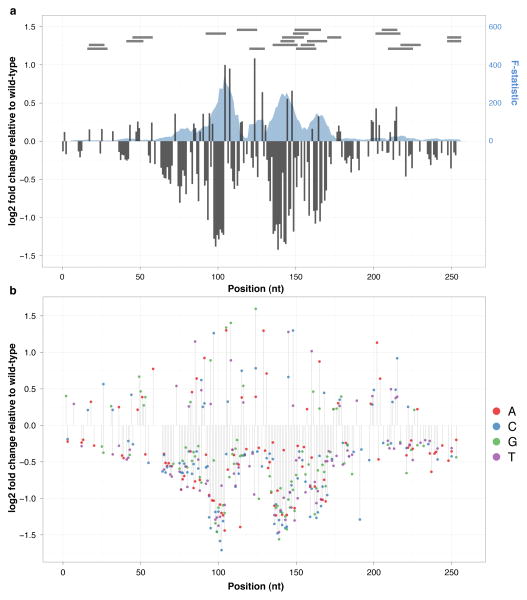
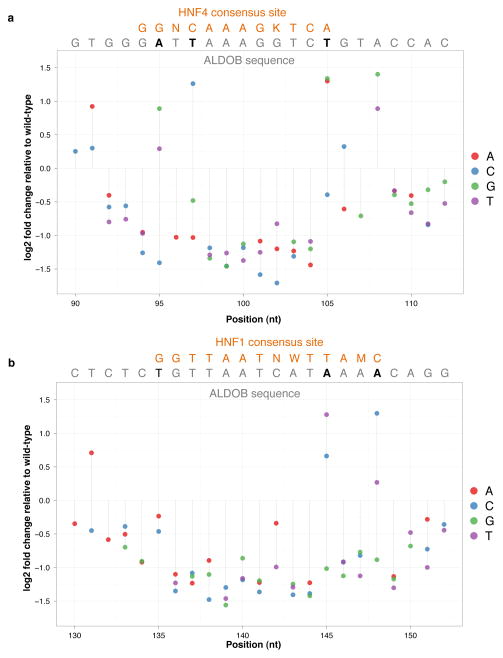
The functional consequences of genetic variation in mammalian regulatory elements are poorly understood. We report the in vivo dissection of three mammalian enhancers at single-nucleotide resolution through a massively parallel reporter assay. For each enhancer, we synthesized a library of >100,000 mutant haplotypes with 2-3% divergence from the wild-type sequence. Each haplotype was linked to a unique sequence tag embedded within a transcriptional cassette. We introduced each enhancer library into mouse liver and measured the relative activities of individual haplotypes en masse by sequencing the transcribed tags. Linear regression analysis yielded highly reproducible estimates of the effect of every possible single-nucleotide change on enhancer activity. The functional consequence of most mutations was modest, with ∼22% affecting activity by >1.2-fold and ∼3% by >2-fold. Several, but not all, positions with higher effects showed evidence for purifying selection, or co-localized with known liver-associated transcription factor binding sites, demonstrating the value of empirical high-resolution functional analysis.
Conflict of interest statement
The authors declare no competing financial interests.
Figures


Comment in
-
In-depth functional dissection of enhancers.Nat Methods. 2012 Apr;9(4):322-3. doi: 10.1038/nmeth.1963. Nat Methods. 2012. PMID: 22563600 No abstract available.
-
Dissecting genomic regulatory elements in vivo.Nat Biotechnol. 2012 Jun 7;30(6):504-6. doi: 10.1038/nbt.2266. Nat Biotechnol. 2012. PMID: 22678387 No abstract available.
Similar articles
-
Systematic dissection and optimization of inducible enhancers in human cells using a massively parallel reporter assay.Nat Biotechnol. 2012 Feb 26;30(3):271-7. doi: 10.1038/nbt.2137. Nat Biotechnol. 2012. PMID: 22371084 Free PMC article.
-
Decoding enhancers using massively parallel reporter assays.Genomics. 2015 Sep;106(3):159-164. doi: 10.1016/j.ygeno.2015.06.005. Epub 2015 Jun 10. Genomics. 2015. PMID: 26072433 Free PMC article. Review.
-
Systematic dissection of coding exons at single nucleotide resolution supports an additional role in cell-specific transcriptional regulation.PLoS Genet. 2014 Oct 23;10(10):e1004592. doi: 10.1371/journal.pgen.1004592. eCollection 2014 Oct. PLoS Genet. 2014. PMID: 25340400 Free PMC article.
-
An IgH enhancer that drives transcription through basic helix-loop-helix and Oct transcription factor binding motifs. Functional analysis of the E(mu)3' enhancer of the catfish.J Biol Chem. 2001 Jul 27;276(30):27825-30. doi: 10.1074/jbc.M100110200. Epub 2001 May 25. J Biol Chem. 2001. PMID: 11375977
-
Functional anatomy of distant-acting mammalian enhancers.Philos Trans R Soc Lond B Biol Sci. 2013 May 6;368(1620):20120359. doi: 10.1098/rstb.2012.0359. Print 2013. Philos Trans R Soc Lond B Biol Sci. 2013. PMID: 23650633 Free PMC article. Review.
Cited by
-
Synthetic refactor of essential genes decodes functionally constrained sequences in yeast genome.iScience. 2022 Aug 18;25(9):104982. doi: 10.1016/j.isci.2022.104982. eCollection 2022 Sep 16. iScience. 2022. PMID: 36093046 Free PMC article.
-
Understanding how cis-regulatory function is encoded in DNA sequence using massively parallel reporter assays and designed sequences.Genomics. 2015 Sep;106(3):165-170. doi: 10.1016/j.ygeno.2015.06.003. Epub 2015 Jun 10. Genomics. 2015. PMID: 26072432 Free PMC article. Review.
-
Massively parallel single-nucleotide mutagenesis using reversibly terminated inosine.Nat Methods. 2016 Nov;13(11):923-924. doi: 10.1038/nmeth.4015. Epub 2016 Oct 3. Nat Methods. 2016. PMID: 27694911 Free PMC article.
-
Genome-scale high-resolution mapping of activating and repressive nucleotides in regulatory regions.Nat Biotechnol. 2016 Nov;34(11):1180-1190. doi: 10.1038/nbt.3678. Epub 2016 Oct 3. Nat Biotechnol. 2016. PMID: 27701403 Free PMC article.
-
Cis and trans effects differentially contribute to the evolution of promoters and enhancers.Genome Biol. 2020 Aug 20;21(1):210. doi: 10.1186/s13059-020-02110-3. Genome Biol. 2020. PMID: 32819422 Free PMC article.
References
-
- Cooper GM, Shendure J. Needles in stacks of needles: finding disease-causal variants in a wealth of genomic data. Nat Rev Genet. 2011;12:628–640. - PubMed
Publication types
MeSH terms
Substances
Grants and funding
LinkOut - more resources
Full Text Sources
Other Literature Sources
Research Materials
