

Only coherent spiking in posterior parietal cortex coordinates looking and reaching
- PMID: 22365554
- PMCID: PMC3315591
- DOI: 10.1016/j.neuron.2011.12.035
Only coherent spiking in posterior parietal cortex coordinates looking and reaching
Abstract
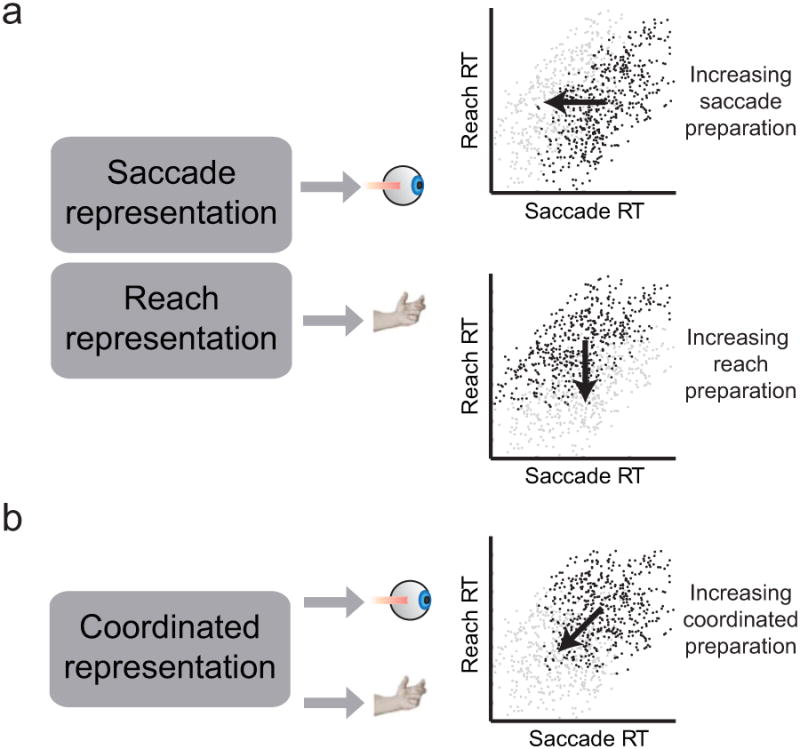
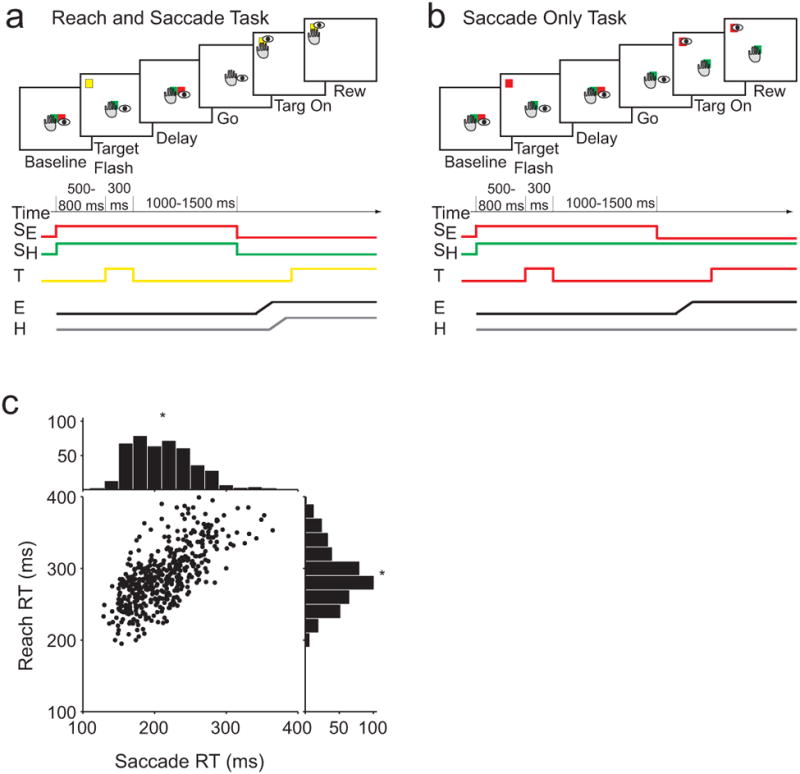
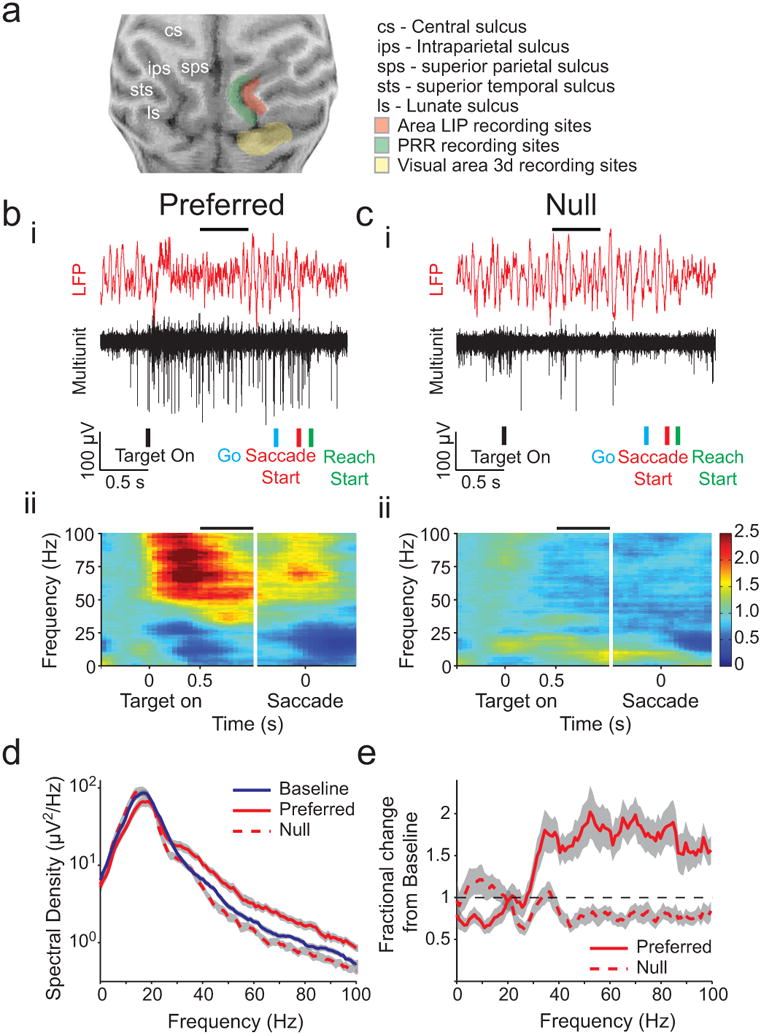
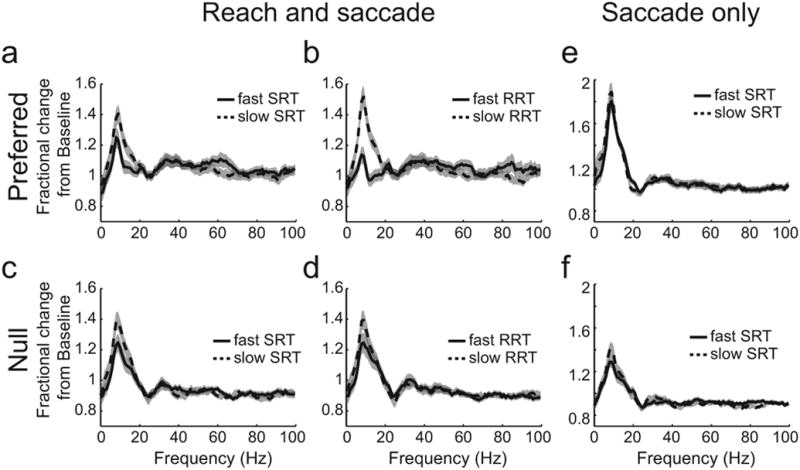
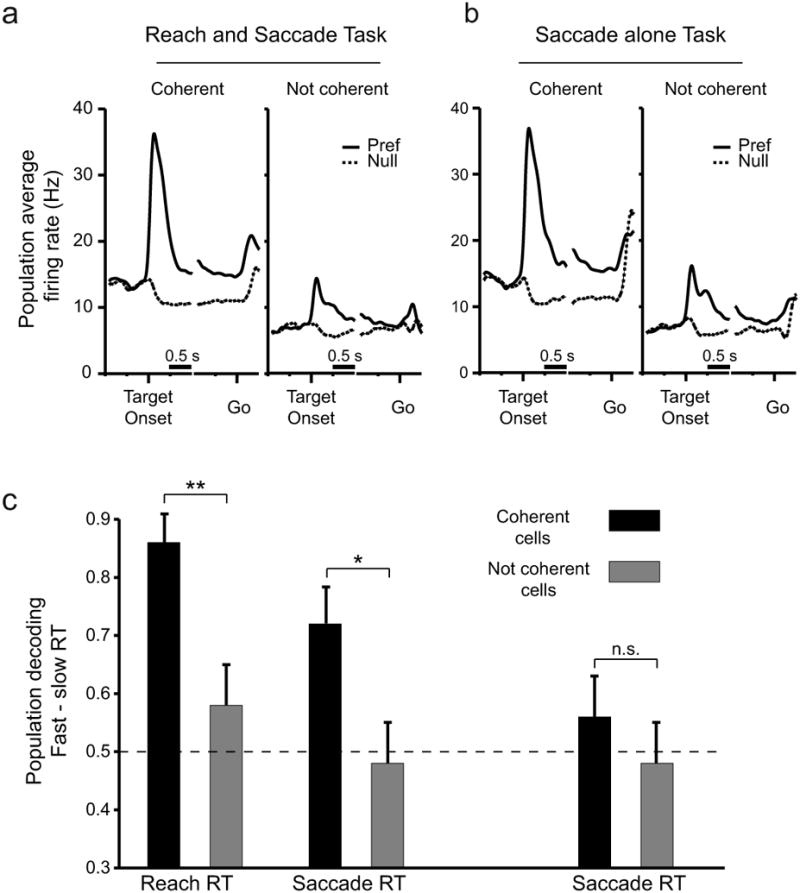
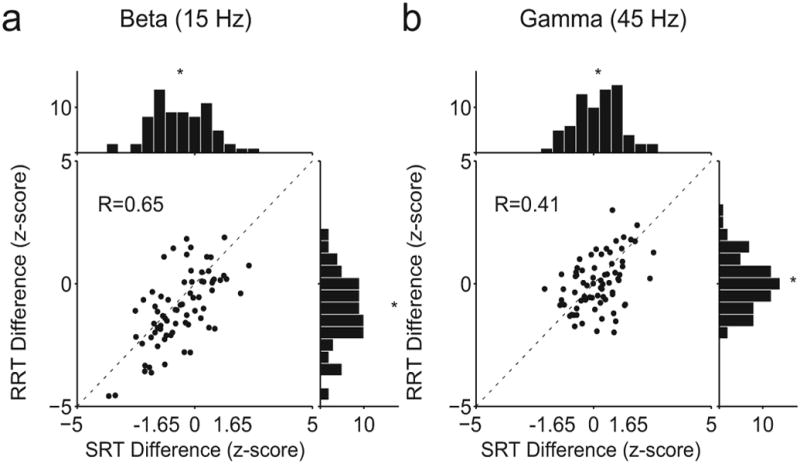
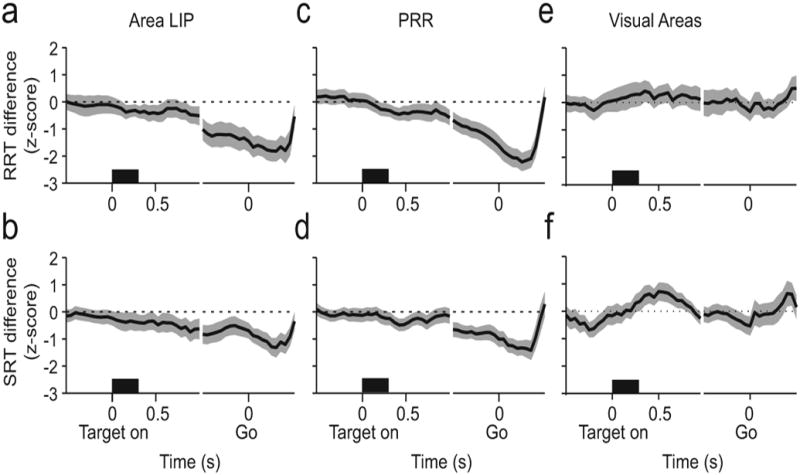
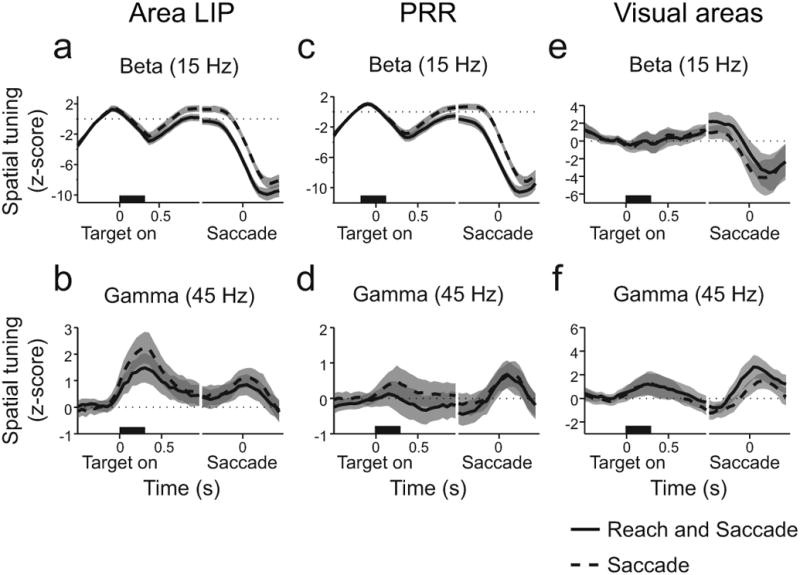
Here, we report that temporally patterned, coherent spiking activity in the posterior parietal cortex (PPC) coordinates the timing of looking and reaching. Using a spike-field approach, we identify a population of parietal area LIP neurons that fire spikes coherently with 15 Hz beta-frequency LFP activity. The firing rate of coherently active neurons predicts the reaction times (RTs) of coordinated reach-saccade movements but not of saccades when made alone. Area LIP neurons that do not fire coherently do not predict RT of either movement type. Similar beta-band LFP activity is present in the parietal reach region but not nearby visual area V3d. This suggests that coherent spiking activity in PPC can control reaches and saccades together. We propose that the neural mechanism of coordination involves a shared representation that acts to slow or speed movements together.
Copyright © 2012 Elsevier Inc. All rights reserved.
Figures
Similar articles
-
Spike-field activity in parietal area LIP during coordinated reach and saccade movements.J Neurophysiol. 2012 Mar;107(5):1275-90. doi: 10.1152/jn.00867.2011. Epub 2011 Dec 7. J Neurophysiol. 2012. PMID: 22157119 Free PMC article.
-
Properties of spike train spectra in two parietal reach areas.Exp Brain Res. 2003 Nov;153(2):134-9. doi: 10.1007/s00221-003-1586-2. Epub 2003 Aug 28. Exp Brain Res. 2003. PMID: 14610632
-
Temporal structure in neuronal activity during working memory in macaque parietal cortex.Nat Neurosci. 2002 Aug;5(8):805-11. doi: 10.1038/nn890. Nat Neurosci. 2002. PMID: 12134152
-
Saccades, salience and attention: the role of the lateral intraparietal area in visual behavior.Prog Brain Res. 2006;155:157-75. doi: 10.1016/S0079-6123(06)55010-1. Prog Brain Res. 2006. PMID: 17027387 Free PMC article. Review.
-
Specialization of reach function in human posterior parietal cortex.Exp Brain Res. 2012 Aug;221(1):1-18. doi: 10.1007/s00221-012-3158-9. Epub 2012 Jul 10. Exp Brain Res. 2012. PMID: 22777102 Review.
Cited by
-
Synchrony and neural coding in cerebellar circuits.Front Neural Circuits. 2012 Dec 11;6:97. doi: 10.3389/fncir.2012.00097. eCollection 2012. Front Neural Circuits. 2012. PMID: 23248585 Free PMC article.
-
Modulation of inhibitory communication coordinates looking and reaching.Nature. 2022 Apr;604(7907):708-713. doi: 10.1038/s41586-022-04631-2. Epub 2022 Apr 20. Nature. 2022. PMID: 35444285 Free PMC article.
-
Distinct neuronal interactions in anterior inferotemporal areas of macaque monkeys during retrieval of object association memory.J Neurosci. 2014 Jul 9;34(28):9377-88. doi: 10.1523/JNEUROSCI.0600-14.2014. J Neurosci. 2014. PMID: 25009270 Free PMC article.
-
Top-down control of exogenous attentional selection is mediated by beta coherence in prefrontal cortex.bioRxiv [Preprint]. 2023 Jan 13:2023.01.11.523664. doi: 10.1101/2023.01.11.523664. bioRxiv. 2023. Update in: Neuron. 2023 Oct 18;111(20):3321-3334.e5. doi: 10.1016/j.neuron.2023.06.025. PMID: 36711697 Free PMC article. Updated. Preprint.
-
Timing of phase-amplitude coupling is essential for neuronal and functional maturation of audiovisual integration in adolescents.Brain Behav. 2020 Jun;10(6):e01635. doi: 10.1002/brb3.1635. Epub 2020 Apr 27. Brain Behav. 2020. PMID: 32342667 Free PMC article.
References
-
- Andersen RA, Snyder LH, Batista AP, Buneo CA, Cohen YE. Posterior parietal areas specialized for eye movements (LIP) and reach (PRR) using a common coordinate frame. Novartis Found Symp. 1998;218:109–122. discussion 122–128, 171–175. - PubMed
-
- Andersen RA, Buneo CA. Intentional maps in posterior parietal cortex. Annu Rev Neurosci. 2002;25:189–220. - PubMed
-
- Andersen RA, Cui H. Intention, action planning, and decision making in parietal-frontal circuits. Neuron. 2009;63:568–583. - PubMed
-
- Barry RJ, Clarke AR, McCarthy R, Selikowitz M, Rushby JA. Arousal and Activation in a Continuous Performance Task. J Psychophysiol. 2005;19:91–99.
-
- Batista AP, Buneo CA, Snyder LH, Andersen RA. Reach plans in eye-centered coordinates. Science. 1999;285:257–260. - PubMed
Publication types
MeSH terms
Grants and funding
LinkOut - more resources
Full Text Sources
Other Literature Sources
