. 2012 Apr;22(4):633-41.
doi: 10.1101/gr.130997.111. Epub 2012 Feb 22.

Global profiling of DNA methylation erasure in mouse primordial germ cells

Affiliations

Global profiling of DNA methylation erasure in mouse primordial germ cells

Sylvain Guibert et al. Genome Res. 2012 Apr.

Abstract

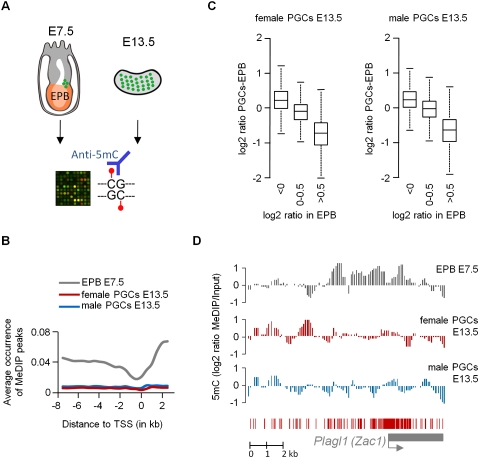
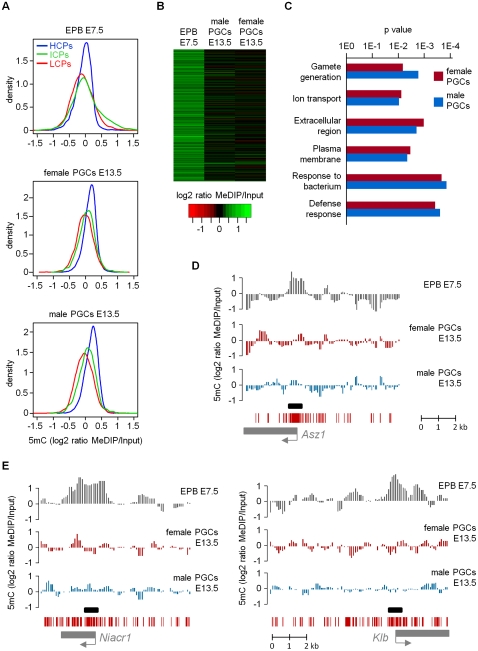
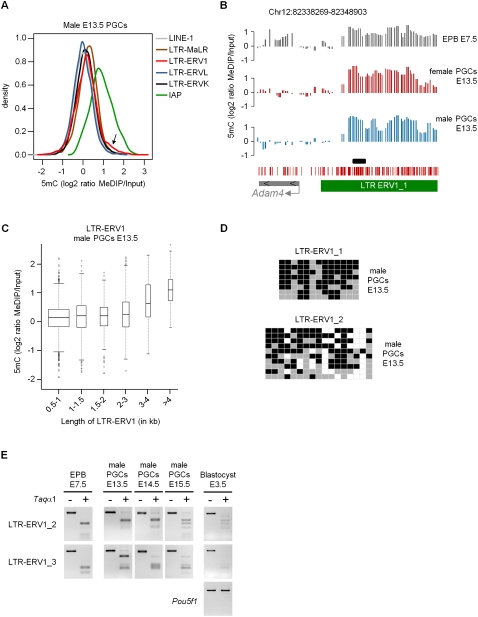
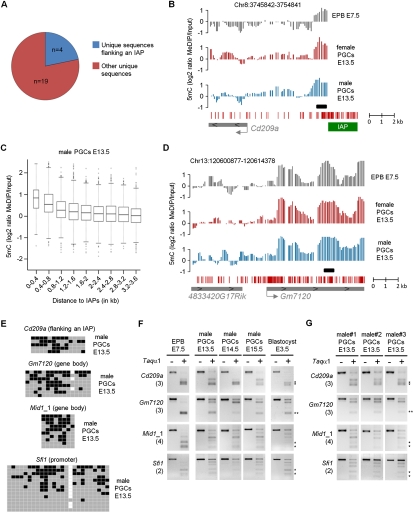
Epigenetic reprogramming, characterized by loss of cytosine methylation and histone modifications, occurs during mammalian development in primordial germ cells (PGCs), yet the targets and kinetics of this process are poorly characterized. Here we provide a map of cytosine methylation on a large portion of the genome in developing male and female PGCs isolated from mouse embryos. We show that DNA methylation erasure is global and affects genes of various biological functions. We also reveal complex kinetics of demethylation that are initiated at most genes in early PGC precursors around embryonic day 8.0-9.0. In addition, besides intracisternal A-particles (IAPs), we identify rare LTR-ERV1 retroelements and single-copy sequences that resist global methylation erasure in PGCs as well as in preimplantation embryos. Our data provide important insights into the targets and dynamics of DNA methylation reprogramming in mammalian germ cells.


Figures

Figure 1.
Figure 1.
Global absence of cytosine methylation in E13.5 PGCs. (A) We hybridized MeDIP samples from E7.5 epiblasts (EPB) and PGCs (green dots) from E13.5 gonads on NimbleGen HD2 arrays covering 11 kb of all gene promoters in the mouse genome. (B) The graph shows the fraction of tiles with a methylation peak as a function of the distance to the transcription start site (TSS). This shows that the enrichment of cytosine methylation in intergenic regions and gene bodies, typical of somatic cells, is erased in E13.5 PGCs. (C) Differences in oligo log2 ratios between E7.5 epiblasts and E13.5 PGCs. The boxplot shows that regions enriched in epiblasts largely lose the methylation signal in PGCs. (D) Erasure of methylation imprints in male and female E13.5 PGCs illustrated at the Plagl1 locus. (Graphs) Smoothed MeDIP log2 ratios of individual oligonucleotides. Here and in other figures, the gene is shown below the graphs as a gray box, the TSS is shown as a gray arrow, and red bars represent the position of the CpGs.
Figure 2.
Figure 2.
Erasure of promoter DNA methylation at all genes in E13.5 PGCs. (A) The density plots show the distribution of all gene promoters (classified as HCPs, ICPs, and LCPs) according to their average MeDIP ratios (calculated in regions covering −700 to +200 bp relative to the transcription start site). The small fraction of enriched promoters in E7.5 epiblasts (EPB) is absent in male and female E13.5 PGCs. (B) The heatmap shows that genes with a methylated promoter in E7.5 epiblasts lose the methylation signal in male and female E13.5 PGCs. (C) Ontology terms enriched in genes that lose promoter cytosine methylation in male and female E13.5 PGCs. (D) Demethylation of the promoter of the germline-specific gene Asz1 in E13.5 PGCs. (Graphs) Smoothed MeDIP over input ratios of individual oligonucleotides. (Black box) Position of the PCR fragment used for COBRA and bisulfite sequencing validations. (E) Demethylation of the promoters of somatic genes Niacr1 and Klb in E13.5 PGCs.
Figure 3.
Figure 3.
Kinetics of promoter DNA demethylation in developing PGCs. (A) DNA methylation of several gene promoters was analyzed by COBRA in E7.5 epiblasts (EPB) and PGCs isolated from E9.5 to E13.5 embryos. Methylation in E13.5 whole embryos (WEs) is shown as a control. Here and in other figures, the number of TaqαI sites in the amplified fragment is indicated in parenthesis, and asterisks mark restriction fragments representing end products of the digestion. (B) Bisulfite sequencing results in PGCs isolated from E8.5 to E13.5 embryos. Tested promoter sequences show high levels of cytosine methylation in E8.5 PGCs and progressive demethylation initiated in early PGC precursors. (Squares) CpG dinucleotides, either unmethylated (gray) or methylated (black). (C) Summary of the bisulfite sequencing methylation data from B and Supplemental Figure 8C. (Graph) Average percentage of cytosine methylation within the amplified fragments for every tested promoter.
Figure 4.
Figure 4.
Cytosine methylation of repetitive elements in E13.5 PGCs. (A) The density plot represents the distribution of MeDIP log2 ratios of oligonucleotides located in various classes of repetitive elements in E13.5 male PGCs. (Arrow) Small proportion of probes in LTR-ERV1 elements with high MeDIP signals. The distribution is identical in female PGCs (Supplemental Fig. 11A). (B) Example of tiled LTR-ERV1 element on chromosome 12 that retains high levels of cytosine methylation in male and female E13.5 PGCs. The graphs show smoothed MeDIP over input ratios of individual oligonucleotides. (Black box) Position of the PCR fragment used for COBRA and bisulfite sequencing validations. The genomic position is indicated above the graphs. (C) The box plot shows the distribution of MeDIP log2 ratios in LTR-ERV1 elements in E13.5 male PGCs as a function of the size of LTR-ERV1 elements. Here and in subsequent box plots, the width of the box is proportional to the square root of the number of data points. The distribution is identical in female PGCs (Supplemental Fig. 11B). (D) Bisulfite sequencing confirms the presence of cytosine methylation in LTR-ERV1 elements in male E13.5 PGCs. In our conditions, the LTR-ERV1_1 primers amplify one single element, whereas the LTR-ERV1_2 primers amplify several elements with sequence polymorphisms. Squares represent CpG dinucleotides as unmethylated (gray), methylated (black), or absent (white). (E) COBRA shows that LTR-ERV1 elements are also methylated in PGCs isolated from male E14.5 and E15.5 embryos, as well as in preimplantation E3.5 blastocysts. Lack of methylation in the Pou5f1 (Oct4) promoter is used as a control for the purity of blastocysts. Note that the LTR-ERV1_3 primers, like the LTR-ERV1_2 primers, amplify several elements with minor sequence differences.
Figure 5.
Figure 5.
Identification of single-copy regions that resist demethylation in PGCs. (A) Proportions of identified single-copy loci that flank repetitive elements (blue) or are not on the vicinity of repetitive elements (red). (B) Example of MeDIP profiles at a single-copy sequence directly flanking an IAP element. The graphs show smoothed MeDIP over input ratios of individual oligonucleotides. The black box marks the position of the PCR fragment used for COBRA and bisulfite sequencing validations. The genomic position is indicated above the graphs. (C) The box plot represents the distribution of log2 ratios in male E13.5 PGCs as a function of the distance to the border of IAPs, which reveals that single-copy regions in the vicinity of IAPs show increased MeDIP signal. The distribution is identical in female PGCs (Supplemental Fig. 11C). (D) Example of MeDIP profiles at a locus not flanked by repetitive elements that retains cytosine methylation in E13.5 PGCs. (E) Bisulfite sequencing validates the presence of cytosine methylation at various single-copy regions in male E13.5 PGCs, one of them flanking an IAP element (Cd209a). Squares represent CpG dinucleotides as unmethylated (gray), methylated (black), or absent (white). The polymorphic CpG residues at the Gm7120 and Sfi1 loci might represent strain differences. (F) COBRA shows that methylation of single-copy loci is also present in PGCs isolated from the E14.5 and E15.5 male embryo, as well as in preimplantation E3.5 blastocysts. (G) COBRA shows that methylation of single-copy loci is found in E13.5 PGCs isolated from three male individuals, indicating that it is not a stochastic event.

Similar articles

Cited by

References

    1. Borgel J, Guibert S, Li Y, Chiba H, Schubeler D, Sasaki H, Forne T, Weber M 2010. Targets and dynamics of promoter DNA methylation during early mouse development. Nat Genet 42: 1093–1100 - PubMed
    1. Dawlaty MM, Ganz K, Powell BE, Hu YC, Markoulaki S, Cheng AW, Gao Q, Kim J, Choi SW, Page DC, et al. 2011. Tet1 is dispensable for maintaining pluripotency and its loss is compatible with embryonic and postnatal development. Cell Stem Cell 9: 166–175 - PMC - PubMed
    1. Feng S, Jacobsen SE, Reik W 2010. Epigenetic reprogramming in plant and animal development. Science 330: 622–627 - PMC - PubMed
    1. Gonzalo S, Jaco I, Fraga MF, Chen T, Li E, Esteller M, Blasco MA 2006. DNA methyltransferases control telomere length and telomere recombination in mammalian cells. Nat Cell Biol 8: 416–424 - PubMed
    1. Guibert S, Forne T, Weber M 2009. Dynamic regulation of DNA methylation during mammalian development. Epigenomics 1: 81–98 - PubMed

Publication types

Associated data