. 2012:2:208.
doi: 10.1038/srep00208. Epub 2012 Jan 4.

Zscan4 transiently reactivates early embryonic genes during the generation of induced pluripotent stem cells

Affiliations

Zscan4 transiently reactivates early embryonic genes during the generation of induced pluripotent stem cells

Tetsuya Hirata et al. Sci Rep. 2012.

Abstract

The generation of induced pluripotent stem cells (iPSCs) by the forced expression of defined transcription factors in somatic cells holds great promise for the future of regenerative medicine. However, the initial reprogramming mechanism is still poorly understood. Here we show that Zscan4, expressed transiently in2-cell embryos and embryonic stem cells (ESCs), efficiently produces iPSCs from mouse embryo fibroblasts when coexpressed with Klf4, Oct4, and Sox2. Interestingly, the forced expression of Zscan4 is required onlyfor the first few days of iPSC formation. Microarray analysis revealed transient and early induction of preimplantation-specific genes in a Zscan4-dependent manner. Our work indicates that Zscan4 is a previously unidentified potent natural factor that facilitates the reprogramming process and reactivates early embryonic genes.


Figures

Figure 1
Figure 1. Zscan4 is not expressed during early phase of iPSC formation, but reactivated later in iPSC cells.
(a) Schematic representation of procedures to examine Zscan4 expression during iPSC formation. TA1 ESCs, F1 hybrid strain (C57BL/6J x 129S6/SvEvTac). A piggyBac transfection involves a main vector PB-TET-MKOS (shown), PB-CAG-rtTA (a tetracycline transactivator), and pCyL43 (transposase). (b) Phase-contrast microscopic images during the formation of cell colonies with authentic ES-like morphology. Day 0 is set when doxycycline (Dox) is added to the complete ES medium 24 hours after a piggyBac transfection. (c) Fluorescence images (left), fluorescence images merged with phase-contrast images (middle), and flow cytometry charts (right) of two representative cell clones established from ESC-like colonies and cultured in the absence of Dox. (d) Appearance of Emerald+ cells (represented as “+”) in the culture. Fraction of Emerald+ cells was measured by the flow cytometry on day 28.
Figure 2
Figure 2. Forced expression of exogenous Zscan4 increases the efficiency of iPSC formation from the wild-type MEFs.
(a) Schematic representation of procedures to examine the effects of exogenous Zscan4 on iPSC formation from wild-type MEFs (C57BL/6J x 129S6/SvEvTac). (b) Representative pictures of 6-well plates stained for ALP 14 days after Dox (and Tmx- or Tmx+) induction. (c) Colonies with authentic ESC morphology and ALP+ were scored. Transfections and Dox inductions were performed in triplicate. Data from two independent experiments are shown. Data are represented as mean±S.E.M. (triplicate wells). *, P < 0.01. (d) Several ESC-like colonies were picked, propagated in the Dox- condition, and established as cell clones: 5 clones (MKOS factors: A2–A6) and 4 clones (MKOS factors + Zscan4). RT-PCR analysis of these clones with pluripotency gene markers: endogenous Oct4, endogenous Sox2, Nanog, Zfp42 (Rex1), and Dax1 (Nr0b1). Gapdh was used as a control. The clone B5 (MKOS factors + Zscan4) was used for the subsequent analyses (e–g). (e) A representative image of ALP staining. (f) A microscopic image showing embryoid bodies (day 4) generated from the clone. (g) Fluorescence microscopic images of the clone after in vitro differentiation from the embryoid body shown in (F), and stained with antibodies against αSMA (mesoderm), AFP (endoderm), GATA4 (endoderm), and βIII-tubulin (ectoderm). Pictures (bottom) are the same images after merging with DAPI-staining. Scale bar, 100 μm. (h–k) The same assays were performed on 5 clones (MKOS factors + Zscan4-ERT2 [Tmx-]: C1-C6) and 4 clones (MKOS factors + Zscan4-ERT2 [Tmx+]: D2–D6). The clone D3 (MKOS factors + Zscan4-ERT2 [Tmx+]) was used for the detailed analyses (i–k).
Figure 3
Figure 3. Zscan4 increases the efficiency of iPSC formation in Tmx-dependent manner from the Zscan4-ERT2-expressing MEFs.
(a) A pCAG-Zscan4cERT2 vector was transfected into V6.5 ESCs (C57BL/6 x 129/Sv) to make Zscan4-ERT2 ESCs (ES-ZERT). ES-ZERT cells were microinjected into blastocysts from ICR mice to generate male chimeric mice, which were subsequently mated with ICR female mice. E13.5 embryos were used to generate mouse embryo fibroblasts (MEFs). MEFs were subjected to genotyping and quantitative RT-PCR. MEFs that carried pCAG-Zscan4cERT2 DNA and expressed exogenous Zscan4c were designated as MEF-ZERT and MEFs that did not were designated as MEF-WT (wild type). (b) Zscan4 expression in MEF-ZERT cell lines compared to that in ESCs. Expression levels of Zscan4 in two different series of MEFs (A1–A13 and B1–B11) were examined by qRT-PCR. Data in triplicate were represented as mean±S.E.M. MEF lines marked with * were used in this work: MEF-ZERT (#A2, #A7, #B5); MEF-WT (#A3). (c) Growth curves of MEF-WT and MEF-ZERT cultured and passaged in Tmx+ and Tmx- conditions. (d) A piggyBac vector (PB-TET-MKOS) carrying doxycycline (Dox)-inducible Myc (M), Klf4 (K), Oct4 (O), and Sox2 (S), was transfected into MEF-ZERT and MEF-WT, respectively. The cells were cultured under the Dox+ Tmx- or Dox+ Tmx+ condition for 14 days, fixed, and stained for alkaline phosphatase (ALP). (e) Representative pictures of 6-well plates stained for ALP. (f) ALP+ ESC-like colonies were scored (mean±S.E.M.). *, P < 0.05. (g) A representative phase-contrast image of an iPSC clone derived from the MEF-ZERT (Tmx+) condition. (h) A representative image of the clone stained for ALP. (i) Fluorescence-microscopic images of the clone after staining with antibodies against SSEA-1 and NANOG. Pictures (right) are the same images after merging with DAPI-staining. (j) Karyotype analysis of iPSCs generated with MKOS (Tmx-: 5 independent clones) and ZMKOS (Tmx+: 8 independent clones) conditions. For each clone, the fraction of cells with a normal karyotype (% euploid) was calculated based on more than 40 metaphase spreads. Then, mean + S.E.M. was calculated for each group (P < 0.05). (k) A representative picture of live E13.5 embryos entirely generated from iPSC clone made with the ZMKOS.
Figure 4
Figure 4. Zscan4 enhances iPSC formation without Myc and is required only for the first few days of induction.
(a) Schematic representation of experimental procedures for iPSC generation. (b) Representative pictures of 6-well plates stained for ALP 20 days after the Dox induction. ALP+ ESC-like colonies were counted (mean±S.E.M.). *, P < 0.05. (c, d) Efficiency of iPSC formation was examined after different Tmx treatments. ALP+ ESC-like colonies were counted 20 days after induction (mean±S.E.M.). Different letters denote statistically significant differences between groups (P < 0.05).
Figure 5
Figure 5. Secondary MEFs derived from iPSCs can generate iPSCs without transfection in Zscan4-dependent manner.
(a) iPSC colonies were generated by transfecting MEF-WT (C57BL/6Jx129S6/SvEvTac) with piggyBac vectors (PB-TET-KOS and PB-TET-Zscan4ERT2-IRES-HisDsRed) and culturing the cells for two weeks under the Dox+ Tmx+ condition. Under fluorescence microscope, Zscan4-ERT2+ colonies could be identified by red-fluorescence. The two red colonies were picked from the wells and propagated in the ES cell culture condition on feeder cells, resulting in the establishment of two cell clones (#2, #4). (b) RT-PCR analysis of these clones and control MEF-WT cells with pluripotency gene markers. (c) A phase-contrast image of the clone (ZKOS#2). (d) A phase-contrast image of the clone (ZKOS#2) after staining with ALP. (e) Fluorescence microscopic images of the clone (ZKOS#2) after staining with antibodies against SSEA-1 and NANOG. (f) A microscopic image showing embryoid bodies (day 4) generated from the iPSC clone (ZKOS#2). (g) Fluorescence images of the clone (ZKOS#2) after in vitro differentiation from the embryoid body shown in (f), and stained with antibodies against αSMA, AFP, GATA4, and βIII-tubulin. Scale bar, 100 μm. (h) E13.5 embryos derived from the clone (ZKOS#2) by the 4N complementation. These embryos were used to generate secondary MEFs (MEF-KOS-ZERT2nd) as described in (a). (i) Global expression profiles of cells were generated by using DNA microarrays. (Upper Panel) A scatter-plot showing pair-wise comparison between the clone (ZKOS#2) and MEF-WT. (Lower Panel) A scatter-plot showing pair-wide comparison between the clone (ZKOS#2) and V6.5 ESC. Spots in color represent genes whose expression show statistically significant differences between samples (FDR≤0.05, fold-change≥2). (j) Morphologies of the MEF-KOS-ZERT2nd cells during the first 6 days of Dox and Tmx treatments. Pictures of cells after ALP-staining on day 17 are also shown. (k) qRT-PCR analysis of the MEF-KOS-ZERT2nd cells. Expression levels of genes are presented as fold-difference compared to those in ESCs. Results using primer pairs that recognize 3′-UTR of genes represent the expression levels of endogenous genes, whereas results using primer pairs that recognize the open reading frame (ORF) of genes represent the combined expression levels of endogenous and exogenous (from the piggyBac vectors) genes.
Figure 6
Figure 6. Microarray analysis reveals Zscan4-dependent activation of preimplantation- and gonads-specific genes during the early phase of iPSC formation from the MEF-KOS-ZERT2nd cells.
(a) Scatter-plots showing pair-wise comparison between Dox+ Tmx- (KOS factors) and Dox- Tmx- (No factor); Dox+ Tmx+ (ZKOS factors) and Dox- Tmx+ (No factor); Dox- Tmx+ (No factor) and Dox- Tmx- (No factor); and Dox+ Tmx+ (ZKOS factors) and Dox+ Tmx- (KOS factors) conditions. Cells were harvested on day 1, 3, and 6 after beginning the Dox or Tmx treatment. Figures in each scatter plot represent the number of genes that showed statistically significant differences between the conditions (FDR≤0.05, fold-change≥2). A list of non-redundant 231 genes were obtained by combining 12 (day 1), 90 (day 3), and 178 (day 6) genes that were more highly expressed in Dox+ Tmx+ (ZKOS) condition than in Dox+ Tmx- (KOS) condition. (b) A heatmap showing the fold-difference of expression levels of 231 genes between Tmx+ and Tmx- conditions. The fold difference for each gene was calculated by dividing the expression level (Tmx+) by the expression level (Tmx-). Among 231 genes, Pramel6 showed the highest fold-difference: 10.2-fold on day 3 (see the Supplementary Table S1). Results obtained by searching the EST database for 231 genes are shown as symbols after gene names: Red circle, genes expressed predominantly in oocytes; blue circle, genes expressed predominantly in preimplantation embryos (1-cell to blastocysts); pink square, genes expressed predominantly in testes or ovaries.
Figure 7
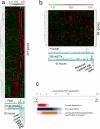
Figure 7. Zscan4-dependent activation of preimplantation – and/or gonad-specific genes is mostly transient.
(a) A heatmap showing expression patterns of 201 genes (a subset of 231 genes) found in the NIA Gene Expression Atlas (22 different adult organs/tissues and cultured cells, from left to right: brain, cerebellum, eyes, skeletal muscle, heart, bone, liver, kidney, bladder, skin, visceral fat, lung, small intestine, large intestine, stomach, placenta, ovary, oocyte, testis, MEF cells, ESCs, and iPSCs). A magnified picture can be found in Supplementary Fig. S6c. Bar graphs show the gene expression levels of two representative genes (Patl2 and D13Ertd608e) among these tissues. (b) A heatmap showing the expression patterns of 99 genes (a subset of 231 genes) found in the GNF database (62 different organs/tissues). A magnified picture can be found in Supplementary Fig. S6d. Bar graphs show the gene expression levels of two representative genes (Pramel6 and D5Ertd577e) among these tissues. (c) A summary diagram showing events occurring during Zscan4-mediated iPSC formation.

Similar articles

Cited by

References

    1. Gurdon J. B., Elsdale T. R. & Fischberg M. Sexually mature individuals of Xenopus laevis from the transplantation of single somatic nuclei. Nature 182, 64–65 (1958). - PubMed
    1. Wakayama T., Perry A. C., Zuccotti M., Johnson K. R. & Yanagimachi R. Full-term development of mice from enucleated oocytes injected with cumulus cell nuclei. Nature 394, 369–374 (1998). - PubMed
    1. Wilmut I., Schnieke A. E., McWhir J., Kind A. J. & Campbell K. H. Viable offspring derived from fetal and adult mammalian cells. Nature 385, 810–813 (1997). - PubMed
    1. Egli D., Sandler V. M., Shinohara M. L., Cantor H. & Eggan K. Reprogramming after chromosome transfer into mouse blastomeres. Curr Biol 19, 1403–1409 (2009). - PMC - PubMed
    1. Takahashi K. & Yamanaka S. Induction of pluripotent stem cells from mouse embryonic and adult fibroblast cultures by defined factors. Cell 126, 663–676 (2006). - PubMed

Publication types

MeSH terms