. 2012 Jan;14(1):1-19.
doi: 10.1593/neo.111122.

Mechanisms regulating the secretion of the promalignancy chemokine CCL5 by breast tumor cells: CCL5's 40s loop and intracellular glycosaminoglycans

Affiliations

Mechanisms regulating the secretion of the promalignancy chemokine CCL5 by breast tumor cells: CCL5's 40s loop and intracellular glycosaminoglycans

Gali Soria et al. Neoplasia. 2012 Jan.

Abstract

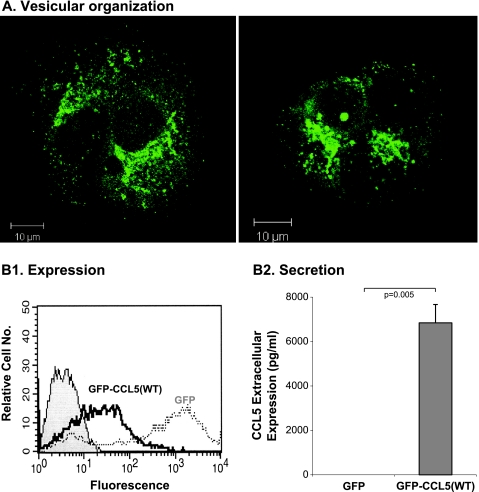
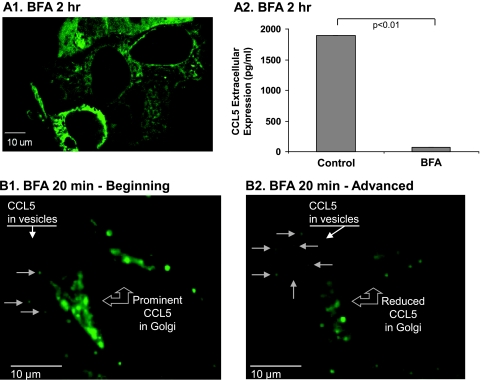
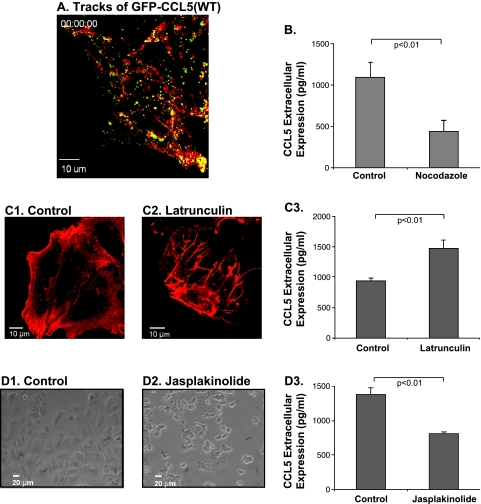
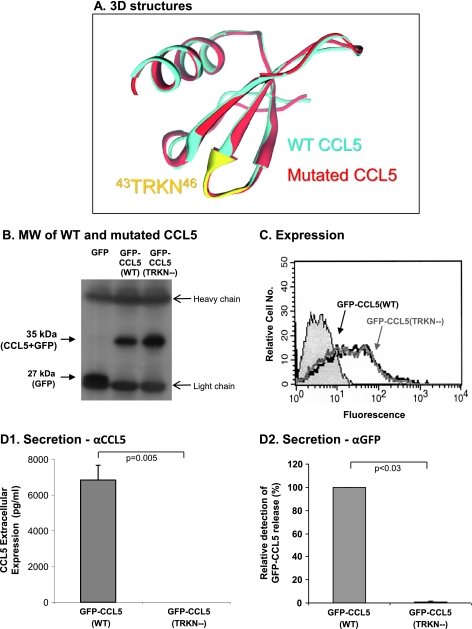
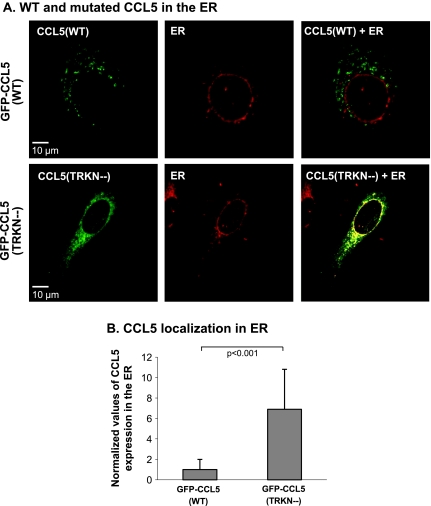
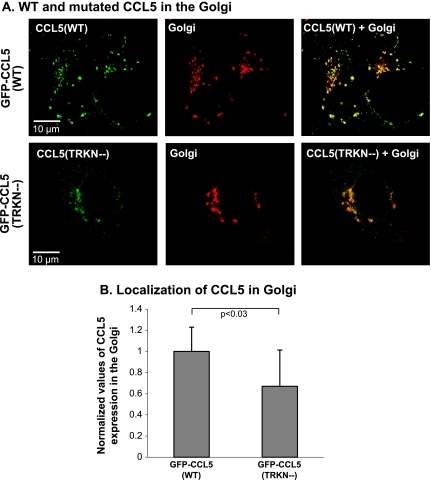
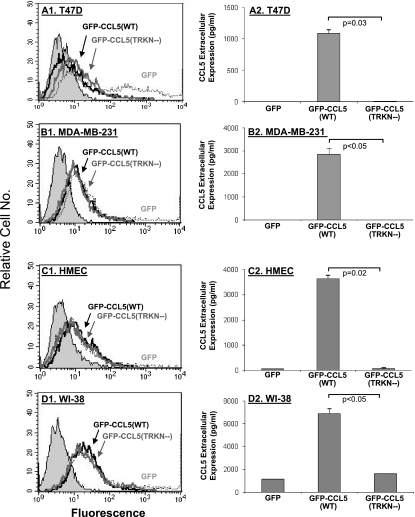
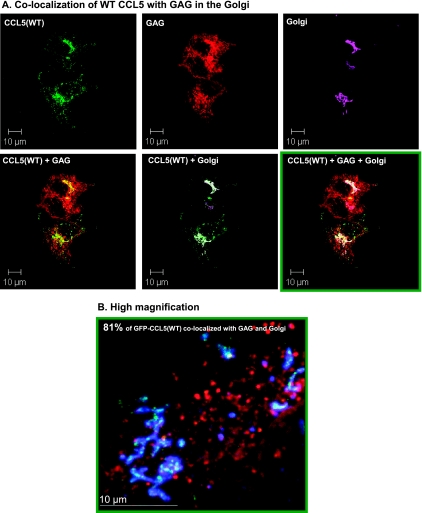
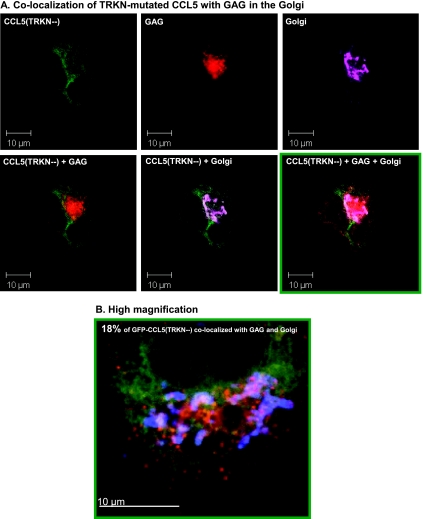
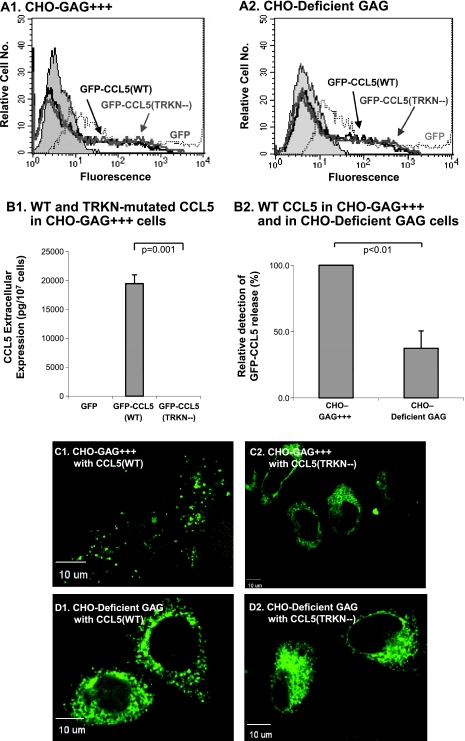
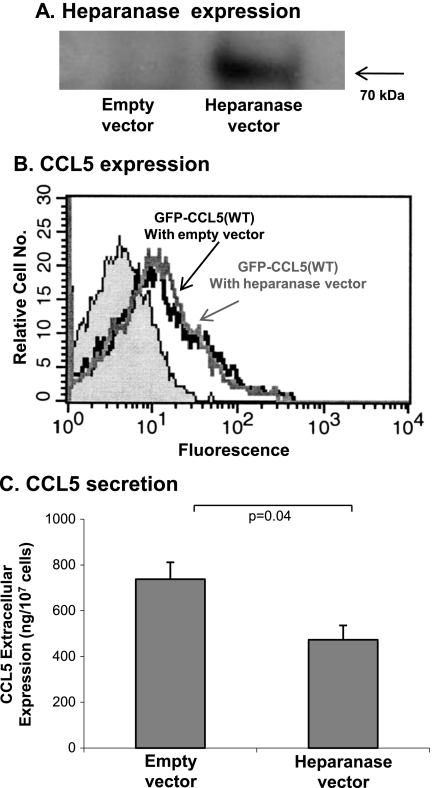
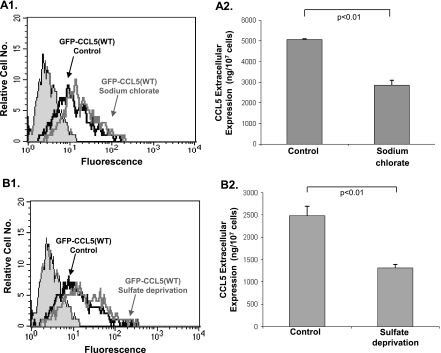
The chemokine CCL5 (RANTES) plays active promalignancy roles in breast malignancy. The secretion of CCL5 by breast tumor cells is an important step in its tumor-promoting activities; therefore, inhibition of CCL5 secretion may have antitumorigenic effects. We demonstrate that, in breast tumor cells, CCL5 secretion necessitated the trafficking of CCL5-containing vesicles on microtubules from the endoplasmic reticulum (ER) to the post-Golgi stage, and CCL5 release was regulated by the rigidity of the actin cytoskeleton. Focusing on the 40s loop of CCL5, we found that the (43)TRKN(46) sequence of CCL5 was indispensable for its inclusion in motile vesicles, and for its secretion. The TRKN-mutated chemokine reached the Golgi, but trafficked along the ER-to-post-Golgi route differently than the wild-type (WT) chemokine. Based on the studies showing that the 40s loop of CCL5 mediates its binding to glycosaminoglycans (GAG), we analyzed the roles of GAG in regulating CCL5 secretion. TRKN-mutated CCL5 had lower propensity for colocalization with GAG in the Golgi compared to the WT chemokine. Secretion of WT CCL5 was significantly reduced in CHO mutant cells deficient in GAG synthesis, and the WT chemokine acquired an ER-like distribution in these cells, similar to that of TRKN-mutated CCL5 in GAG-expressing cells. The release of WT CCL5 was also reduced after inhibition of GAG presence/synthesis by intracellular expression of heparanase, inhibition of GAG sulfation, and sulfate deprivation. The need for a (43)TRKN(46) motif and for a GAG-mediated process in CCL5 secretion may enable the future design of modalities that prevent CCL5 release by breast tumor cells.


Figures

Figure 1
Figure 1
CCL5 is organized in vesicles and is secreted by breast tumor cells. Human MCF-7 breast tumor cells were transiently transfected by a vector expressing GFP-CCL5(WT) or by a control vector expressing GFP only (=GFP). (A) GFP-CCL5(WT) acquires a vesicular distribution in the tumor cells, as determined by confocal analysis (similar localization pattern was observed for HA-tagged WT CCL5, as shown in Figure W1). This vesicular distribution is similar to that of endogenous CCL5 produced by the cells [27]. Live cell imaging of motility of GFP-CCL5(WT)-containing vesicles is demonstrated in Video W1. The control empty vector expressing GFP had a diffuse nonorganized distribution in the cells (data not shown). (B) Determination of transfection yields and of CCL5 secretion by MCF-7 cells transfected with the GFP-CCL5(WT) vector and by the control GFP vector. (B1) Transfection yields based on GFP expression in FACS analysis. (B2) CCL5 secretion to the cell supernatants, determined by ELISA assays with antibodies against human CCL5, as described in procedure 1 in Materials and Methods. In each part of the figure, the results are representatives of at least n = 3.
Figure 2
Figure 2
Vesicles containing CCL5 are shuttled from the ER to the post-Golgi stage. The effects of treatment by BFA on the intracellular organization of vesicles containing GFP-CCL5(WT) and on CCL5 secretion. Control cells were treated by the solubilizer of the drug. (A) Human MCF-7 breast tumor cells were transiently transfected by a vector expressing GFP-CCL5(WT), and the pool of cells was split to cells treated by BFA or to control cells treated by the solubilizer of the drug. The drug did not affect cell viability (data not shown). (A1) Confocal analysis showing cells treated by BFA for 2 hours. Before BFA addition, the localization of GFP-CCL5(WT) was as in Figure 1A (vesicular and punctuate; data not shown). The picture is a representative of multiple cells analyzed in n = 2. (B) ELISA analysis of CCL5 amounts in supernatants of cells untreated or treated by BFA (for 2–5 hours, as described in Materials and Methods). The results are similar to those obtained for the endogenous CCL5 produced by breast tumor cells, shown to be mobilized toward secretion in an ER-to-Golgi-dependent manner [27]. CCL5 secretion to the cell supernatants was determined by ELISA assays with antibodies against human CCL5, as described in procedure 1 in Materials and Methods. (B) The effect of short-term treatment by BFA (20 minutes) on motility of CCL5-containing vesicles. Human MCF-7 cells were transiently transfected by GFP-CCL5(WT), and the motility of CCL5-containing vesicles was determined by live cell imaging in spinning disk confocal microscope after the treatment by BFA. The figure provides static pictures of Video W2. (B1) At the beginning of the BFA treatment, prominent localization of CCL5 was detected in the Golgi, and the chemokine was also found in peripheral vesicles. (B2) At advanced stages after this short treatment by BFA, there was almost an entire collapse of the Golgi, CCL5 was minimally detected in the Golgi, but it was still vastly localized in peripheral vesicles. The pictures are representatives of multiple cells analyzed in n ≥ 2.
Figure 3
Figure 3
The trafficking and secretion of CCL5 are regulated by cytoskeleton elements. The characteristics of CCL5 trafficking and secretion were determined in human MCF-7 breast tumor cells, transiently transfected by a vector expressing GFP-CCL5(WT). (A) GFP-CCL5(WT)-containing vesicles traffic on structured cellular tracks. The cells were imaged by live cell imaging in confocal microscopy. The figure shows a static picture of Video W3. To visualize the paths taken by moving GFP-CCL5(WT)-containing vesicles, images were projected in two dimensions using the maximum-value-per-pixel algorithm of Slidebook. The two-dimensional algorithm was pseudocolored in red and expended through the entire time-lapse series. The tracks used by GFP-CCL5(WT)-containing vesicles are demonstrated in red, and the vesicles containing GFP-CCL5(WT) (green) are shown in yellow, owing to the superimposition of red and green signals. The pictures are representatives of multiple cells analyzed in n = 2. (B, C, D) The roles of microtubules (B) and of actin filaments (C, D) in regulating the motility of CCL5-containing vesicles and the secretion of CCL5 were determined in MCF-7 cells. After transient transfection with a vector expressing GFP-CCL5(WT), the pool of cells was split to cells treated with (B) nocodazole (microtubule depolymerizing), (C) latrunculin (actin depolymerizing), or (D) jasplakinolide (actin polymerizing) and to control cells that were treated by the solubilizers of the drugs. The drugs did not affect cell viability (data not shown). (B) CCL5 secretion after treatment by nocodazole was determined as indicated below. In parallel, the motility of vesicles containing GFP-CCL5(WT) was followed by live cell imaging in confocal microscopy, without (Video W4) and following nocodazole treatment (Video W5). (C) The effects of latrunculin on the organization of actin filaments were determined by staining control cells (C1) or latrunculin-treated cells (C2) with phalloidin. (C3) CCL5 secretion after latrunculin treatment was determined as indicated below. (D) The effects of jasplakinolide on the shape and contour of the cells were determined by light microscope in control cells (D1) and in jasplakinolide-treated cells (D2). (D3) CCL5 secretion after jasplakinolide treatment was determined as indicated below. (B, C3, D3) CCL5 secretion to the cell supernatants was determined by ELISA analyses with antibodies against human CCL5, as described in procedure 1 in the Materials and Methods. In all parts of the figure, the ELISA analyses are of a representative experiment of n = 3, and the pictures are representatives of multiple cells analyzed in n = 3 (except for the live cell imaging in B, where n = 2).
Figure 4
Figure 4
The 43TRKN46 motif of CCL5 is essential for its secretion by breast tumor cells. (A) The predicted three-dimensional structure of 43TRKN46-mutated CCL5, superimposed on the three-dimensional structure of WT CCL5 obtained by x-ray analyses [33]. Of note, this article also showed similar x-ray structures for WT CCL5 and the 44RKNR47 CCL5 mutant. (B) Human MCF-7 breast tumor cells were transiently transfected by vectors expressing GFP-CCL5(WT), GFP-CCL5(TRKN-), or GFP alone (GFP), followed by determination of chemokine expression in cell lysates. The chemokines were immunoprecipitated by mAb against GFP, and Western blot analysis was performed with mAb against GFP. The results are of a representative experiment of n > 3. (C, D) The effects of the 43TRKN46 mutation on CCL5 secretion. Human MCF-7 breast tumor cells were transiently transfected by vectors expressing GFP-CCL5(WT) or GFP-CCL5 (TRKN-), followed by determination of chemokine secretion. (C) FACS analyses showing the transfection yields of vectors expressing GFP-CCL5(WT) or GFP-CCL5(TRKN-). (D) Determination of CCL5 secretion to cell supernatants, performed by ELISA assays. (D1) ELISA assays with antibodies against human CCL5, as described in procedure 1 in Materials and Methods. (D2) ELISA assays with antibodies against human GFP, as described in procedure 2 in Materials and Methods. The results in all parts of the figure are of a representative experiment of n > 3. Additional ELISA analyses with other combinations of antibodies, showing the reduced secretion of GFP-CCL5 (TRKN-), are provided in Figure W2.
Figure 5
Figure 5
GFP-CCL5(TRKN-) is found in the ER in higher propensity than GFP-CCL5(WT). Confocal pictures showing the localization pattern of GFP-CCL5(WT) and of GFP-CCL5(TRKN-) with the ER marker calnexin. (A) Human MCF-7 breast tumor cells were transiently transfected by vectors expressing GFP-CCL5(WT) or GFP-CCL5(TRKN-). The colocalization of CCL5 (green) with an ER marker (calnexin, red) was determined by confocal analysis and shown in orange/yellow. The pictures also show that, in contrast to the vesicular organization of GFP-CCL5(WT), the GFP-CCL5(TRKN-) had a diffuse/reticulate organization. The nondirectional and limited motility of GFP-CCL5(TRKN-) in the tumor cells is shown in Video W6. The pictures are representatives of multiple cells analyzed in n > 3. (B) Quantitative analysis of the colocalization of the mutated and GFP-CCL5(WT) molecules with calnexin, performed on a large number of cells. The graph shows the mean ± SD of the normalized values obtained in n = 3. P values were obtained from actual values of the computational analysis before normalization.
Figure 6
Figure 6
GFP-CCL5(TRKN-) reaches the Golgi apparatus but in a lower propensity than GFP-CCL5(WT). Confocal pictures showing the localization pattern of GFP-CCL5(WT) and of GFP-CCL5(TRKN-) with the Golgi marker a mannosidase IB. (A) Human MCF-7 breast tumor cells were transiently transfected by vectors expressing GFP-CCL5(WT) or GFP-CCL5(TRKN-). The colocalization of CCL5 (green) with a Golgi marker (a mannosidase IB, red) was determined by confocal analysis and is shown in orange/yellow. The pictures also show that, in contrast to the vesicular organization of GFP-CCL5(WT), the GFP-CCL5(TRKN-) had a diffuse/reticulate organization. The nondirectional and limited motility of GFP-CCL5(TRKN-) in the tumor cells is shown in Video W6. The pictures are representatives of multiple cells analyzed in n > 3. (B) Quantitative analysis of the colocalization of the mutated and GFP-CCL5(WT) molecules with a mannosidase IB, performed on a large number of cells. The graph shows the mean ± SD of the normalized values obtained in n = 3. P values were obtained from actual values of the computational analysis before normalization.
Figure 7
Figure 7
The 43TRKN46 sequence is required for CCL5 secretion in many cell types. Different cell types were transiently transfected by vectors expressing GFP-CCL5(WT), GFP-CCL5(TRKN-), or GFP alone (GFP) (please note the different scales used for the various cell types in the ELISA analyses presented). (A1–D1) FACS analyses showing the transfection yields of GFP-CCL5(WT) and GFP-CCL5(TRKN-) in the different cell types. (A2–D2) The secretion of CCL5 was determined by ELISA assays, performed on cell supernatants of the different cell types, with antibodies against human CCL5, as described in procedure 1 in the Materials and Methods. (A1, A2) Human T47D nonaggressive breast carcinoma cells. (B1, B2) Human MDA-MB-231 metastatic breast carcinoma cells. (C1, C2) Human mammary normal epithelial cells. (D1, D2) Human WI-38 normal lung fibroblasts. In all parts of the figure, the results are of a representative experiment of n = 3.
Figure 8
Figure 8
The localization of GFP-CCL5(WT) with GAG in the Golgi. Human MCF-7 breast tumor cells were transiently transfected by a vector expressing GFP-CCL5(WT). The colocalization of CCL5 (green) with GAG (red), and with a Golgi marker (a mannosidase IB, purple/blue) was determined by confocal analysis. (A) The pictures show each of the proteins alone, as well as combinations of the following: GFP-CCL5(WT) + GAG, GFP-CCL5(WT) + Golgi, or GFP-CCL5(WT) + GAG + Golgi. The colocalization of GFP CCL5(WT) + GAG + Golgi is demonstrated in white. (B) Higher magnification of the colocalization of GFP-CCL5(WT) with GAG and Golgi, demonstrated in bright white. The percentage of GFP-CCL5(WT) that was colocalized with GAG and Golgi is indicated in the figure. The pictures are representatives of multiple cells analyzed in n = 3.
Figure 9
Figure 9
The localization of GFP-CCL5(TRKN-) with GAG in the Golgi. Human MCF-7 breast tumor cells were transiently transfected by a vector expressing GFP-CCL5(TRKN-). The colocalization of CCL5 (green) with GAG (red), and with a Golgi marker (a mannosidase IB, purple/blue) was determined by confocal analysis. (A) The pictures show each of the proteins alone, as well as combinations of the following: GFP-CCL5(TRKN-)+ GAG, GFP-CCL5(TRKN-)+ Golgi, or GFP-CCL5(TRKN-)+ GAG + Golgi. The colocalization of GFP-CCL5 (TRKN-)+ GAG + Golgi is demonstrated in white. (B) Higher magnification of the colocalization of GFP-CCL5(TRKN-) with GAG and Golgi, demonstrated in bright white. The percentage of GFP-CCL5(TRKN-) that was colocalized with GAG and Golgi is indicated in the figure. The pictures are representatives of multiple cells analyzed in n = 3.
Figure 10
Figure 10
The secretion of GFP-CCL5(WT) and its vesicular organization are perturbed in CHO-deficient GAG cells. CHO cells were transfected by vectors expressing GFP-CCL5(WT), GFP-CCL5(TRKN-), or GFP alone (GFP), followed by determination of secretion and intracellular organization of CCL5. The analyses were performed in cells that expressed normal GAG levels, termed herein CHO-GAG+++ cells (=CHO-K1 cells), compared to CHO cells deficient in GAG expression, termed herein CHO-deficient GAG cells (=CHO-pgsA-745 cells). (A1, A2) FACS analyses showing the transfection yields of GFP-CCL5(WT) and GFP-CCL5(TRKN-) in CHO-GAG+++ cells and in CHO-deficient GAG cells. The results are of a representative experiment of n = 2–3. (B) CCL5 secretion, determined by ELISA assays performed on supernatants of the different cell types, with antibodies against human CCL5, as described in procedure 1 in Materials and Methods. (B1) Secretion of WT CCL5 in CHO-GAG+++ cells, transfected with vectors expressing GFP-CCL5(WT), GFP-CCL5(TRKN-), or GFP vector only (=GFP). The results are of a representative experiment of n = 3. (B2) Secretion of CCL5 by CHO-GAG+++ cells and by CHO-deficient GAG cells, transfected with GFP-CCL5(WT). The results are mean ± SD of normalized values of CCL5 secretion in n = 3. P values were obtained from actual values of the computational analysis before normalization. (C, D) Intracellular localization of GFP-CCL5(WT) (C1, D1) and of GFP-CCL5(TRKN-) (C2, D2) in CHO-GAG+++ cells (C1, C2) and in CHO-deficient GAG cells (D1, D2). In C and D, the results are of a representative experiment of n = 2, with multiple cells analyzed in each experiment.
Figure 11
Figure 11
Intracellular expression of heparanase leads to reduced secretion of GFP-CCL5(WT) by breast tumor cells. Human MCF-7 breast tumor cells were transiently transfected by a vector expressing GFP-CCL5(WT). In parallel, the cells were transfected with a myc-tagged vector expressing heparanase or by a control myc-tagged empty vector. (A) Western blot showing the expression of heparanase in cells transfected with heparanase-containing vector but not in cells transfected with the control vector. The analysis was performed with antibodies against myc. The MW of the heparanase is the one expected for the intracellularly expressed enzyme, tagged by myc (∼65 kDa of heparanase + the myc tag). No signal was detected in the control cells transfected with the myc-tagged vector only because of its small MW (in the conditions used for appropriate detection of the heparanase, the myc protein run out of the gel). (B) FACS analysis showing the transfection yields of GFP-CCL5(WT) in cells transfected with the heparanase vector and those transfected with control vector. (C) CCL5 secretion to the cell supernatants determined by ELISA assays with antibodies against human CCL5, as described in procedure 1 in Materials and Methods. In all parts of the figure, the results are of a representative experiment of n > 3.
Figure 12
Figure 12
The secretion of GFP-CCL5(WT) by breast tumor cells is inhibited by reduced sulfation of GAG. The effects of GAG undersulfation on the secretion of CCL5 were determined in MCF-7 cells, transfected with GFP-CCL5(WT). (A) Treatment by sodium chlorate, a competitive inhibitor of ATP-sulfurylase that inhibits the sulfation process of GAG (30 mM, 48 hours). (B) The cells were exposed to sulfate deprivation by growth in sulfate-deficient medium (48 hours). (A1, B1) FACS analyses showing the transfection yields of GFP-CCL5(WT) in control cells and in cells in which undersulfation was induced by (A1) sodium chlorate or (B1) sulfate deprivation. (A2, B2) The secretion of CCL5 was determined by ELISA assays, performed on supernatants of control cells and of cells in which undersulfation was induced, performed with antibodies against human CCL5, as described in procedure 1 in Materials and Methods. (A2) Sodium chlorate. (B2) Sulfate deprivation. In all parts of the figure, the results are of a representative experiment of n = 3.

Similar articles

Cited by

References

    1. Hanahan D, Weinberg RA. Hallmarks of cancer: the next generation. Cell. 2011;144:646–674. - PubMed
    1. Colotta F, Allavena P, Sica A, Garlanda C, Mantovani A. Cancer-related inflammation, the seventh hallmark of cancer: links to genetic instability. Carcinogenesis. 2009;30:1073–1081. - PubMed
    1. Hagemann T, Balkwill F, Lawrence T. Inflammation and cancer: a double-edged sword. Cancer Cell. 2007;12:300–301. - PMC - PubMed
    1. Soria G, Ben-Baruch A. The CCL5/CCR5 Axis in Cancer. New York, NY: Humana Press; 2009.
    1. Soria G, Ben-Baruch A. The inflammatory chemokines CCL2 and CCL5 in breast cancer. Cancer Lett. 2008;267:271–285. - PubMed

Publication types

MeSH terms

LinkOut - more resources