

SAINT-MS1: protein-protein interaction scoring using label-free intensity data in affinity purification-mass spectrometry experiments
- PMID: 22352807
- PMCID: PMC3744231
- DOI: 10.1021/pr201185r
SAINT-MS1: protein-protein interaction scoring using label-free intensity data in affinity purification-mass spectrometry experiments
Abstract
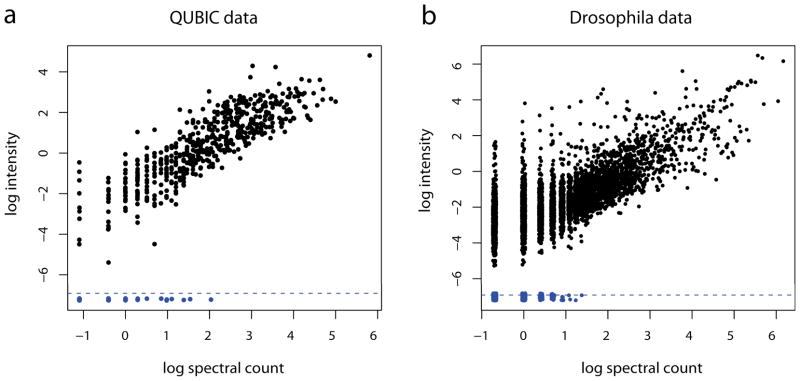
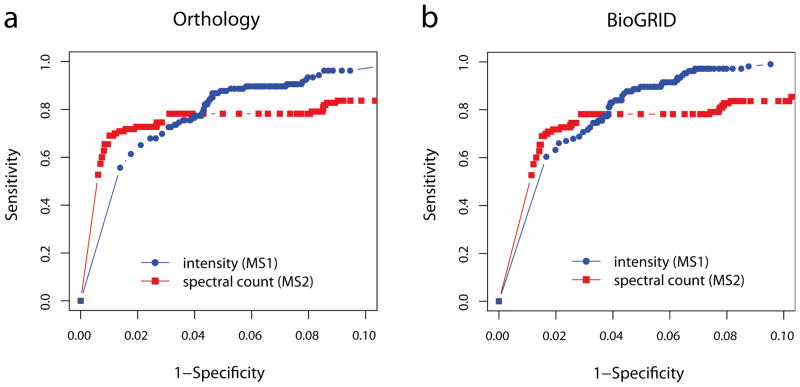
We present a statistical method SAINT-MS1 for scoring protein-protein interactions based on the label-free MS1 intensity data from affinity purification-mass spectrometry (AP-MS) experiments. The method is an extension of Significance Analysis of INTeractome (SAINT), a model-based method previously developed for spectral count data. We reformulated the statistical model for log-transformed intensity data, including adequate treatment of missing observations, that is, interactions identified in some but not all replicate purifications. We demonstrate the performance of SAINT-MS1 using two recently published data sets: a small LTQ-Orbitrap data set with three replicate purifications of single human bait protein and control purifications and a larger drosophila data set targeting insulin receptor/target of rapamycin signaling pathway generated using an LTQ-FT instrument. Using the drosophila data set, we also compare and discuss the performance of SAINT analysis based on spectral count and MS1 intensity data in terms of the recovery of orthologous and literature-curated interactions. Given rapid advances in high mass accuracy instrumentation and intensity-based label-free quantification software, we expect that SAINT-MS1 will become a useful tool allowing improved detection of protein interactions in label-free AP-MS data, especially in the low abundance range.
Figures
Similar articles
-
Computational and informatics strategies for identification of specific protein interaction partners in affinity purification mass spectrometry experiments.Proteomics. 2012 May;12(10):1639-55. doi: 10.1002/pmic.201100537. Proteomics. 2012. PMID: 22611043 Free PMC article. Review.
-
Analyzing protein-protein interactions from affinity purification-mass spectrometry data with SAINT.Curr Protoc Bioinformatics. 2012 Sep;Chapter 8:8.15.1-8.15.23. doi: 10.1002/0471250953.bi0815s39. Curr Protoc Bioinformatics. 2012. PMID: 22948729 Free PMC article.
-
SAINT: probabilistic scoring of affinity purification-mass spectrometry data.Nat Methods. 2011 Jan;8(1):70-3. doi: 10.1038/nmeth.1541. Epub 2010 Dec 5. Nat Methods. 2011. PMID: 21131968 Free PMC article.
-
SAINTq: Scoring protein-protein interactions in affinity purification - mass spectrometry experiments with fragment or peptide intensity data.Proteomics. 2016 Aug;16(15-16):2238-45. doi: 10.1002/pmic.201500499. Epub 2016 May 27. Proteomics. 2016. PMID: 27119218
-
Resolving protein interactions and complexes by affinity purification followed by label-based quantitative mass spectrometry.Proteomics. 2012 May;12(10):1623-38. doi: 10.1002/pmic.201100438. Proteomics. 2012. PMID: 22610586 Review.
Cited by
-
Data Independent Acquisition analysis in ProHits 4.0.J Proteomics. 2016 Oct 21;149:64-68. doi: 10.1016/j.jprot.2016.04.042. Epub 2016 Apr 29. J Proteomics. 2016. PMID: 27132685 Free PMC article.
-
Computational and informatics strategies for identification of specific protein interaction partners in affinity purification mass spectrometry experiments.Proteomics. 2012 May;12(10):1639-55. doi: 10.1002/pmic.201100537. Proteomics. 2012. PMID: 22611043 Free PMC article. Review.
-
Defining the Caprin-1 Interactome in Unstressed and Stressed Conditions.J Proteome Res. 2021 Jun 4;20(6):3165-3178. doi: 10.1021/acs.jproteome.1c00016. Epub 2021 May 3. J Proteome Res. 2021. PMID: 33939924 Free PMC article.
-
The emerging role of mass spectrometry-based proteomics in drug discovery.Nat Rev Drug Discov. 2022 Sep;21(9):637-654. doi: 10.1038/s41573-022-00409-3. Epub 2022 Mar 29. Nat Rev Drug Discov. 2022. PMID: 35351998 Review.
-
Protein network analysis and functional enrichment via computational biotechnology unravel molecular and pathogenic mechanisms of kidney stone disease.Biomed J. 2023 Apr;46(2):100577. doi: 10.1016/j.bj.2023.01.001. Epub 2023 Jan 13. Biomed J. 2023. PMID: 36642221 Free PMC article. Review.
References
-
- Chen GI, Gingras AC. Affinity-purification mass spectrometry (AP-MS) of serine/threonine phosphatases. Methods. 2007;42:298–305. - PubMed
-
- Collins MO, Choudhary JS. Mapping multiprotein complexes by affinity purification and mass spectrometry. Current Opinion in Biotechnology. 2008;19:324–330. - PubMed
-
- Gingras AC, Gstaiger M, Raught B, Aebersold R. Analysis of protein complexes using mass spectrometry. Nat Rev Mol Cell Biol. 2007;8:645–654. - PubMed
Publication types
MeSH terms
Substances
Grants and funding
LinkOut - more resources
Full Text Sources
Molecular Biology Databases
