. 2012 Feb 19;14(3):276-86.
doi: 10.1038/ncb2432.

Stromal control of cystine metabolism promotes cancer cell survival in chronic lymphocytic leukaemia

Affiliations

Stromal control of cystine metabolism promotes cancer cell survival in chronic lymphocytic leukaemia

Wan Zhang et al. Nat Cell Biol. .

Abstract

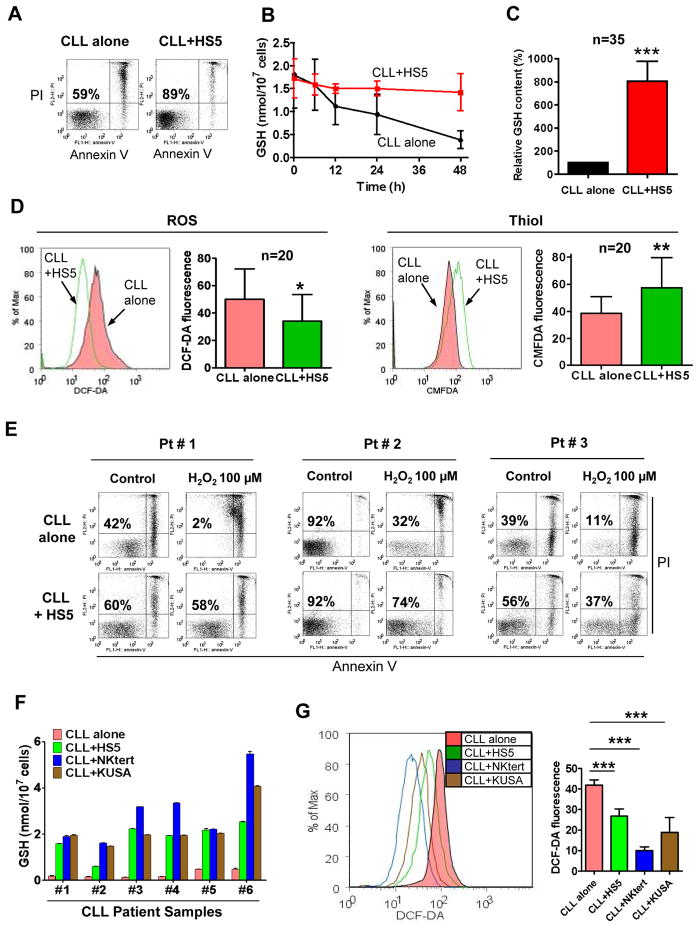
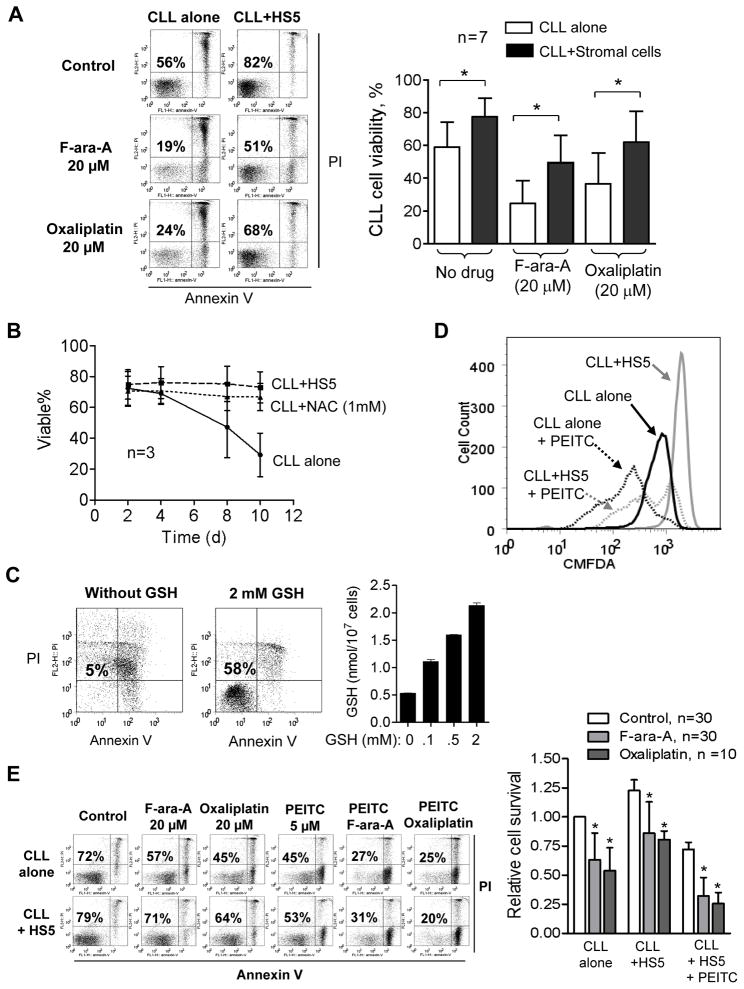
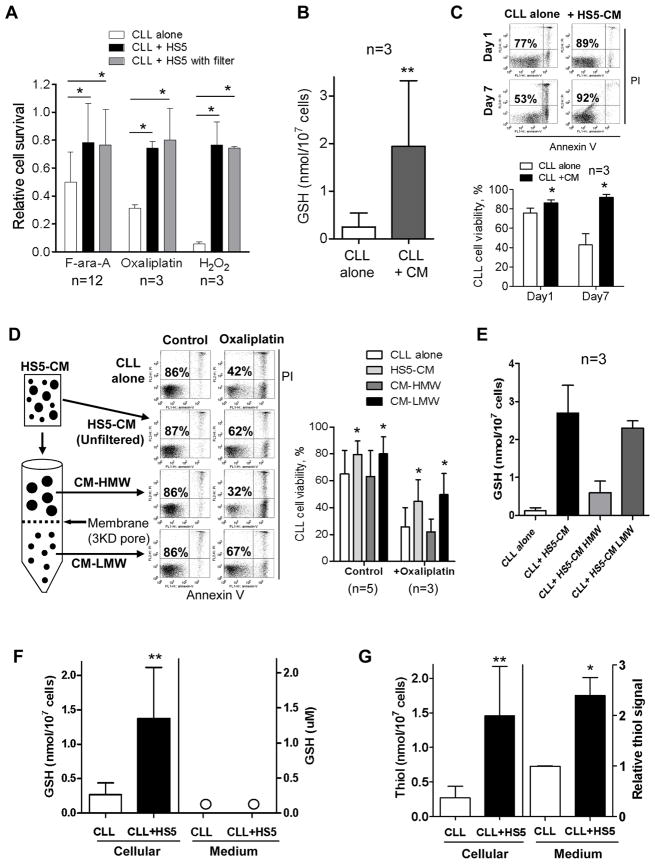
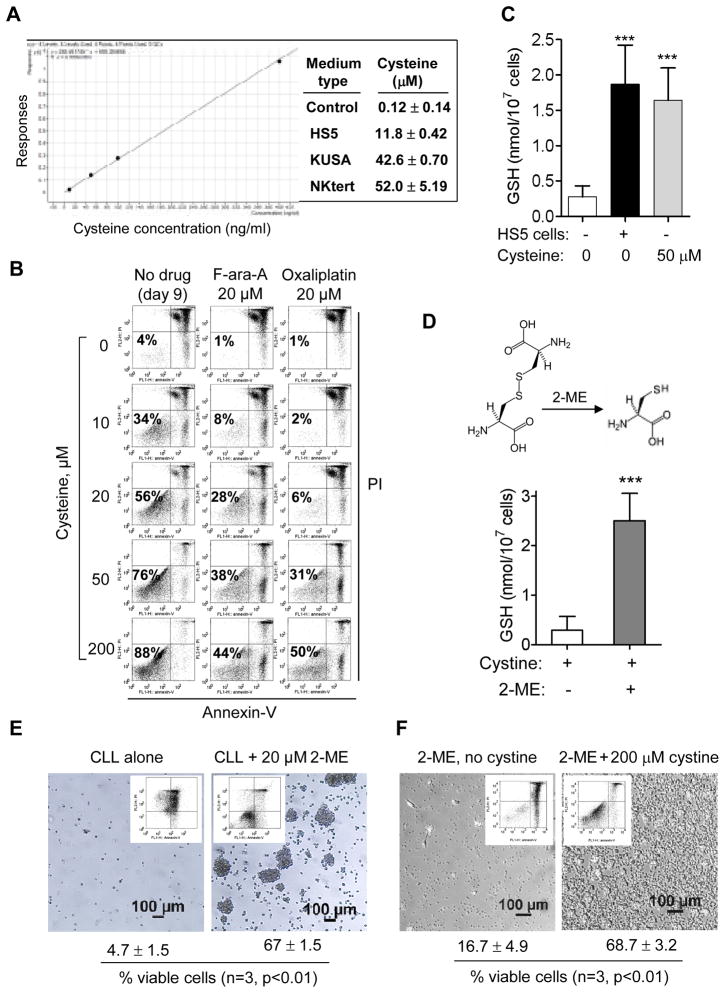
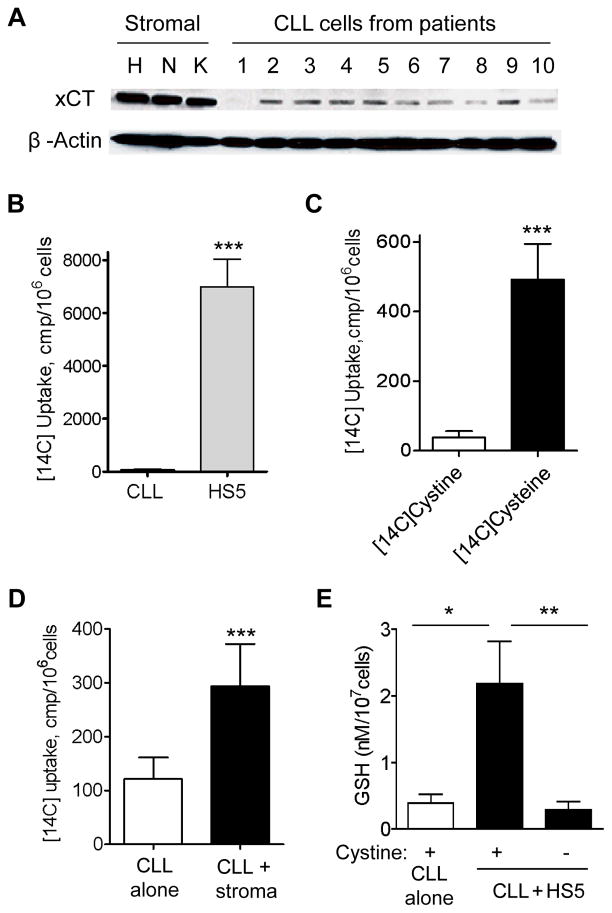
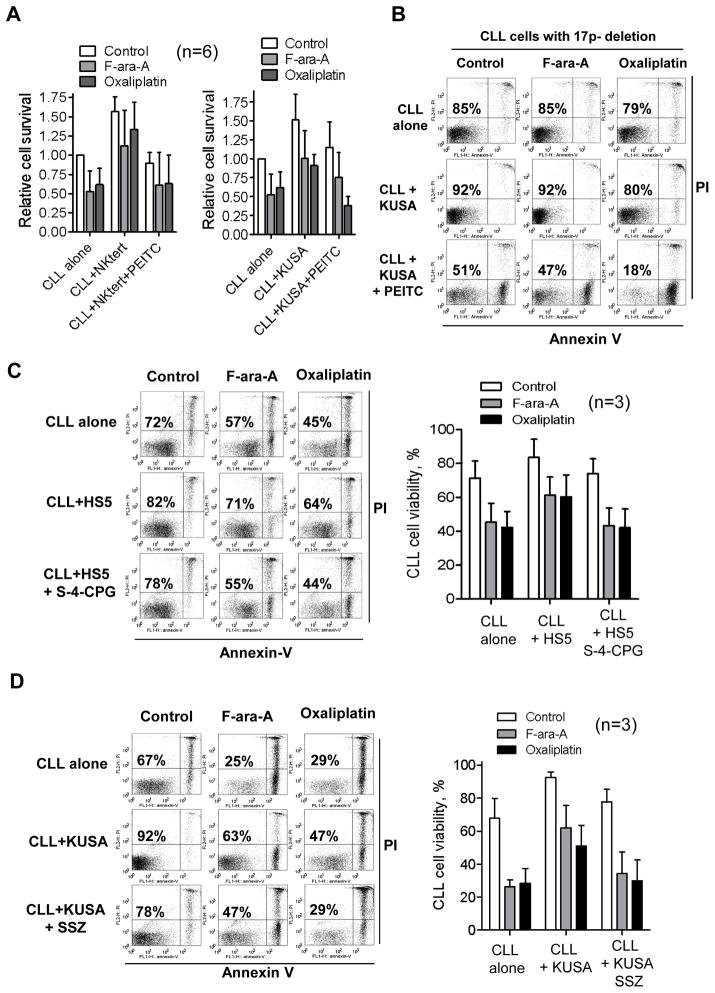
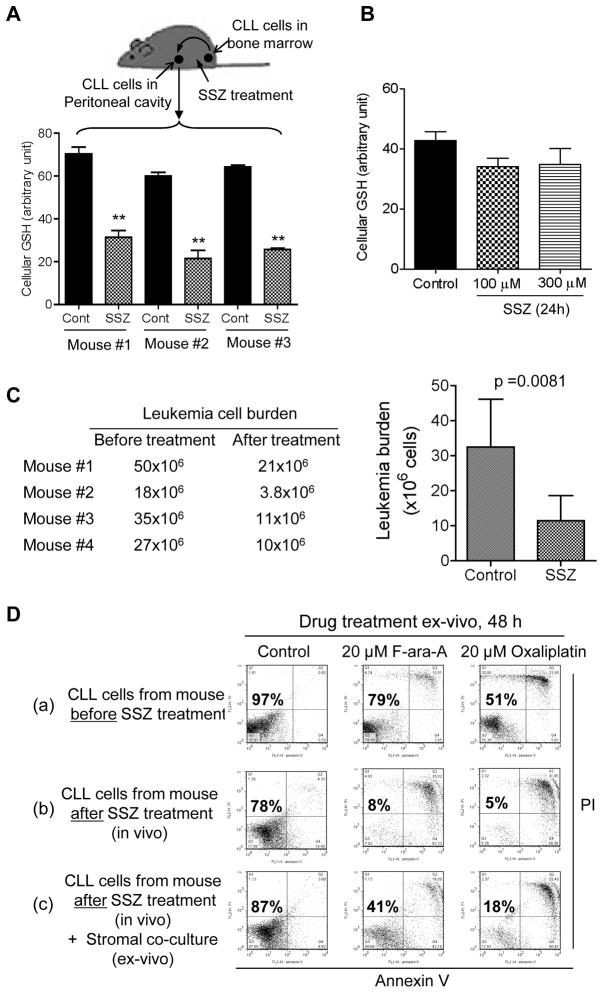
Tissue stromal cells interact with leukaemia cells and profoundly affect their viability and drug sensitivity. Here we show a biochemical mechanism by which bone marrow stromal cells modulate the redox status of chronic lymphocytic leukaemia (CLL) cells and promote cellular survival and drug resistance. Primary CLL cells from patients exhibit a limited ability to transport cystine for glutathione (GSH) synthesis owing to a low expression level of Xc-transporter. In contrast, bone marrow stromal cells effectively import cystine and convert it to cysteine, which is then released into the microenvironment for uptake by CLL cells to promote GSH synthesis. The elevated level of GSH enhances leukaemia cell survival and protects them from drug-induced cytotoxicity. Furthermore, disabling this protective mechanism significantly sensitizes CLL cells to drug treatment in the stromal environment. This stromal-leukaemia interaction is critical for CLL cell survival and represents a key biochemical pathway for effectively targeting leukaemia cells to overcome drug resistance in vivo.


Conflict of interest statement

Competing financial interests

The authors declare no competing financial interests.

Figures

Figure 1
Figure 1. Bone marrow stromal cells enhanced GSH synthesis in CLL cells and relieved their ROS stress
(A) Comparison of CLL cell viability cultured alone or with bone marrow stromal cells (HS5) for 3 days. Cell viability was measured by annexin-V/PI staining. The numbers indicate % of viable cells (annexin-V/PI double negative). The data are representative of 3 experiments using different CLL samples. (B) Time course of GSH contents in CLL cells cultured alone or with HS5 cells. Values are mean ± SD of 3 separate experiments using 3 CLL samples. (C) Comparison of GSH levels in CLL cells cultured alone or with HS5 cells for 72 h. The bar graph shows mean ± SEM of 35 different CLL samples, each measured in triplicate. (***, p<0.001). (D) Determination of cellular ROS and thiol contents in CLL cells cultured alone or with HS5 cells (72 h), detected by flow cytometry analysis. Representative histograms and quantitative comparison of mean values ± SD from 20 CLL samples are shown (*, p< 0.05; **, p<0.01). (E) HS5 stromal cells protected CLL cells from spontaneous apoptosis and cell death induced by H2O2 (100 μM). Cell viability was measured by annexin-V/PI staining. The number in each dot blot indicates the average % of viable cells (annexin-V/PI double negative) from 3 different CLL samples. (F) Comparison of GSH levels in CLL cells after a 3-day culture alone or with different bone marrow stromal cells (HS5, StromaNKtert, KUSA-H1). Each bar shows the mean ± SD of the GSH contents (n= 6 CLL samples). (G) Decrease of ROS in CLL cells after co-culture with stromal cells (HS5, StromaNKtert, and KUSA-H1). Cellular ROS were detected by flow cytometry using 1 μM DCF-DA. Representative histograms and the means ± SD of 4 separate experiments with 4 CLL patient samples are shown (***, p<0.001).
Figure 2
Figure 2. Critical role of GSH in mediating stromal protection of CLL cells from spontaneous and drug-induced cell death
(A) Protection of CLL cells by bone marrow stromal cells (HS5) in the presence and absence of F-ara-A (20 μM) or oxaliplatin (20 μM). CLL cells were pre-cultured with HS5 cells for 24 h, followed by drug exposure for 48 h. Cell viability was measured by annexin-V/PI double staining. Representative dot plots of a CLL sample are shown on the left panel; the numbers indicates % of viable cells (annexin-V/PI double negative). Data of additional 6 patient samples are shown in Supplementary Fig S3A. The right panel shows the mean ± SD of the data from the 7 CLL samples. *, p<0.05. (B) Increase of CLL cell viability by HS5 stromal cells or by exogenous N-acetylcysteine (NAC). CLL cells were cultured alone, with HS5 cells, or with 1 mM NAC as indicated. Cell viability was measured by flow cytometry analysis (mean ± SD, n= 3 CLL samples for each condition). (C) Protection of CLL cells by exogenous GSH in culture medium without stromal cells (7 days). The data are representative of 3 experiments. The right panel shows the glutathione contents in CLL cells incubated with the indicated concentrations of GSH in the culture medium. (D) Determination of total thiol levels in CLL cells cultured alone or with HS5 cells in the presence or absence of PEITC (5 μM, 5 h). Cellular thiol was measured by flow cytometry using the thiol-reactive dye CMFDA. Representative histographs of 3 separate experiments are shown. (E) Annexin-V/PI assay of cell viability after CLL cells were cultured alone or with HS5 cells in the presence or absence of F-ara-A (20 μM, 48 h), oxaliplatin (20 μM, 48 h), PEITC (5 μM, 5 h), or their combination. The number in each dot blot indicates % of viable cells. The bar graph on the right shows the mean ± SD of viable cells from multiple experiments using 10–30 different CLL patient samples as indicated. *, p<0.05.
Figure 3
Figure 3. The low-molecular-weight fraction of the stromal medium enhanced GSH synthesis in CLL cells and promoted cell survival
(A) Comparison of drug-induced loss of cell viability in CLL cells cultured alone or with HS5 cells in the presence or absence of a trans-well membrane. F-ara-A: 20 μM, 48 h; oxaliplatin: 20 μM, 48 h; H2O2: 100 μM, 24 h. Cell viability was measured by annexin-V/PI staining (mean ± SD; n=3; *, p<0.05). (B) Comparison of GSH levels in CLL cells after cultured in regular medium or in HS5-conditioned medium (HS5-CM) for 72 h. **, p<0.01 (mean±SD; n=3 different CLL samples). (C) Annexin V-PI assay of CLL cell viability after culture in regular medium or in HS5-conditioned medium for 1 or 7 days. The number in each dot blot indicates % of viable cells (annexin-V/PI double negative). The bar graph shows the mean ± SD of 3 separate experiments using 3 CLL samples, *, p<0.05. (D) Separation of HS5-conditioned medium into high-molecular-weight (HMW) and low-molecular-weight (LMW) fractions and their effect on the viability CLL cells exposed to oxaliplatin (20 μM, 48 h). Cell viability was measured by annexin-V/PI staining. The bar graph on the right shows the mean ± SD of multiple experiments using 3–5 CLL patient samples as indicated. *, p<0.05. (E) Enhancement of GSH levels in CLL cells by HS5-conditioned medium or its LMW fraction. Each bar shows mean ± SD of 3 experiments using 3 CLL samples. (F) Comparison of GSH levels in CLL cells or in the medium cultured with or without HS5 cells for 72h. Bar graphs of mean ± SD from 3 experiments with 3 CLL samples are shown (**, p < 0.01). (G) Comparison of thiol levels in CLL cells or in the medium cultured with or without HS5 cells for 72 h. The end-point method was used to measure thiol levels as described in Methods. Bar graphs of mean ± SD from 3 experiments with 3 CLL patient samples are shown (*, p<0.05; **, p< 0.01).
Figure 4
Figure 4. Generation of cysteine by bone marrow stromal cells was essential to enhance GSH synthesis in CLL cells and promote their survival
(A) Quantitation of cysteine in the conditioned medium of three bone marrow stromal cell lines using triple quadrupole mass spectrometer LC-MS/MS (Agilent 6460). Media were collected freshly and analyzed immediately. Culture medium without stromal cells was used as a control. All samples were analyzed in triplicates. The left panel is the standard curve showing the linearity of this assay. The LC-MS/MS spectra are shown in Supplementary Fig S5. (B) Effect of cysteine on CLL cell survival and drug sensitivity cultured without stromal cells. The indicated concentrations of cysteine were added daily to the culture medium. On day 7, F-ara-A or oxaliplatin was added and incubated for additional 48 h. Cell viability was measured by flow cytometry analysis on day 9. Representative dot plots of 3 separate experiments are shown. (C) Extracellular cysteine (50 μM, added daily for 3 days) enhanced CLL cellular GSH contents. CLL cells cultured alone or with HS5 cells were used as controls for comparison. Each bar represents mean ± SD of 4 separate experiments (***, p<0.001). (D) Conversion of extracellular cystine to cysteine by 2-mercaptolethanol (2-ME, 20 μM) enhanced GSH synthesis in CLL cells (mean ± SD; n= 3 different CLL samples; ***, p<0.001). (E) Conversion of cystine to cysteine in the culture medium by 2-ME (20 μM) promoted CLL cell long-term survival in culture with regular RPMI medium (containing 200 μM cystine). Photographs and flow cytometry analysis of cell viability using annexin-V/PI double staining were performed on day 20. The mean ± SD (% viable cells) of 3 separate experiments are indicated below each panel. (F) 2-ME could not protect CLL cells when cystine was withdrew from the medium. Cell viability was measured using annexin-V/PI double staining, and the mean ± SD (% viable cells) of 3 separate experiments are indicated below each panel.
Figure 5
Figure 5. Leukemia cells (CLL) exhibited low ability to directly utilize cystine and were dependent on stromal cells to convert cystine to cysteine for GSH synthesis
(A) Expression of the cystine transporter xCT in HS5 (H), StromaNKtert (N), and KUSA-H1 (K) stromal cells and primary CLL cells from patients (n=10). The un-cropped blots are shown as Supplementary Information. (B) Comparison of [14C]cystine uptake by HS5 stromal cells and CLL cells (4 h incubation). Bar graph of mean ± SD of 3 separate experiments is shown (***, p<0.001). (C) Effective uptake of [14C]cysteine, but not [14C]cystine by CLL cells (4 h incubation; mean ± SD; n=3 patient samples; ***, p<0.001). (D) Stromal cells (HS5) increased the uptake of radioactivity by CLL cells in culture medium containing [14C]cystine (6 h incubation; mean ± SD; n=3 patient samples; ***, p<0.001). (E) Extracellular cystine was required for stromal cells to enhance GSH synthesis in CLL cells. CLL cell were co-culture with HS5 cells in presence or absence of 200 μM cystine for 72 h, and GSH contents in CLL cell extracts were measured (mean ± SD; n=3 patient samples; *, p<0.05; **, p<0.01).
Figure 6
Figure 6. Overcoming stromal-induced drug resistance in CLL cells by depleting GSH in leukemia cells or blocking cystine uptake by stromal cells
(A) Effect of PEITC (5 μM) on CLL cell viability cultured alone or with StromaNktert (left panel) or KUSA-H1 stromal cells (right panel) in the presence or absence of F-ara-A or oxaliplatin. CLL cells in co-culture were exposed to F-ara-A (20 μM) or oxaliplatin (20 μM) for 48 h. PEITC (5 μM) was added during the last 5 h of incubation. Cell viability was analyzed by annexin-V/PI assay. The bar graph shows the mean ± SD of 6 separate experiments using 6 CLL samples. (B) Effect of PEICT on drug-resistant leukemia cells from a CLL patient with chromosome 17p deletion. CLL cells were cultured alone or with KUSA-H1 stromal cells in the presence or absence of 20 μM F-ara-A or 20 μM oxaliplatin for 48 h. PEITC (10 μM) was added during the last 5 h of incubation. The numbers show % of viable cells. (C) Sensitization of CLL cells to F-ara-A and oxaliplatin by inhibition of cystine transport with (S)-4-carboxyphenylglycine (S-4-CPG). CLL and HS5 cells in co-culture were first incubated with S-4-CPG (500 μM) for 24 h, and then exposed to F-ara-A (20 μM) or oxaliplatin (20 μM) for 48 h. Cell viability was analyzed by annexin-V/PI assay. Representative dot plots are shown with % viable cells (annexin-V/PI double negative) indicated. The right panel shows the mean ± SD of 3 separate experiments. (D) Sensitization of CLL cells to F-ara-A and oxaliplatin by inhibition of cystine transport using sulfasalazine (SSZ). CLL and stromal (KUSA-H1) cells in co-culture were first incubated with SSZ (300 μM) for 24 h to inhibit cystine transport, and then exposed to F-ara-A (20 μM) or oxaliplatin (20 μM) for 48 h. Cell viability was analyzed by flow cytometry. Representative dot plots are shown with % viable cells indicated. The right panel shows the mean ± SD of 3 separate experiments using 3 CLL patient samples.
Figure 7
Figure 7. Effect of abolishing GSH protection on CLL cells by blocking cystine uptake by stromal cells in vivo
(A) Effect of the sulfasalazine (SSZ) on CLL cellular GSH in vivo. CLL cells were obtained by peritoneal washing from Tcl-1 transgenic mice that had developed CLL disease with leukemia cells in the peritoneal cavity. After a 7-day recovery period, the mice were treated with SSZ (8 mg/mouse, i.p., every 12 h x 3 injections). A second sample of peritoneal CLL cells was obtained 12 h after the last SSZ treatment. GSH was measured as described in Methods (mean ± SD; n=3; **, p<0.01). (B) Effect of SSZ on GSH in CLL cells cultured in vitro without stromal cells. Primary CLL cells were cultured overnight to remove stromal cells attaching to the flask surface. CLL cells in suspension were transferred to fresh flasks and incubated with or without SSZ (100–300 μM, 24 h). GSH was measured in triplicate (mean ± SD; n=3). (C) Treatment of Tcl-1 mice with SSZ (8 mg/kg, i.p., 3 times per week, M/W/F) significantly reduced the leukemia cell burden. The numbers in the left panel show the total leukemia cell counts in the peritoneal cavity of each mouse before and after SSZ treatment; the right bar graph shows the mean ± SD of the leukemia cells in all 4 mice tested. (D) Treatment of Tcl-1 mice with SSZ decreased leukemia cell viability and enhanced drug sensitivity ex-vivo. (a) Leukemia cells were isolated from a CLL mouse by peritoneal washing. Cell viability was analyzed before and after the cells were incubated ex-vivo with F-ara-A or oxaliplatin as indicated. (b) The same mouse was allowed a 7-day recovery period and then treated with SSZ (8 mg/kg, i.p., three times per week, M/W/F). At 24 h after the last drug treatment, CLL cells were isolated and cell viability was analyzed before and after the cells were incubated ex-vivo with F-ara-A or oxaliplatin as indicated. (c) The experimental conditions were the same as in (b), except that the CLL cells were co-cultured with bone marrow stromal cells (StromaNKtert).

Comment in

Similar articles

Cited by

References

    1. Zwiebel JA, Cheson BD. Chronic lymphocytic leukemia: staging and prognostic factors. Seminars in oncology. 1998;25:42–59. - PubMed
    1. Keating MJ, et al. Biology and treatment of chronic lymphocytic leukemia. Hematology/the Education Program of the American Society of Hematology. American Society of Hematology. 2003:153–175. - PubMed
    1. Chiorazzi N, Rai KR, Ferrarini M. Chronic lymphocytic leukemia. The New England journal of medicine. 2005;352:804–815. - PubMed
    1. Tam CS, Keating MJ. Chemoimmunotherapy of chronic lymphocytic leukemia. Best practice & research. 2007;20:479–498. - PubMed
    1. Rai KR, Chiorazzi N. Determining the clinical course and outcome in chronic lymphocytic leukemia. The New England journal of medicine. 2003;348:1797–1799. - PubMed

Publication types

MeSH terms

LinkOut - more resources