. 2012 Feb 8;15(2):186-200.
doi: 10.1016/j.cmet.2012.01.009.

Mitochondrial fission triggered by hyperglycemia is mediated by ROCK1 activation in podocytes and endothelial cells

Affiliations

Mitochondrial fission triggered by hyperglycemia is mediated by ROCK1 activation in podocytes and endothelial cells

Wenjian Wang et al. Cell Metab. .

Abstract

Several lines of evidence suggest that mitochondrial dysfunction plays a critical role in the pathogenesis of microvascular complications of diabetes, including diabetic nephropathy. However, the signaling pathways by which hyperglycemia leads to mitochondrial dysfunction are not fully understood. Here we examined the role of Rho-associated coiled coil-containing protein kinase 1 (ROCK1) on mitochondrial dynamics by generating two diabetic mouse models with targeted deletions of ROCK1 and an inducible podocyte-specific knockin mouse expressing a constitutively active (cA) mutant of ROCK1. Our findings suggest that ROCK1 mediates hyperglycemia-induced mitochondrial fission by promoting dynamin-related protein-1 (Drp1) recruitment to the mitochondria. Deletion of ROCK1 in diabetic mice prevented mitochondrial fission, whereas podocyte-specific cA-ROCK1 mice exhibited increased mitochondrial fission. Importantly, we found that ROCK1 triggers mitochondrial fission by phosphorylating Drp1 at serine 600 residue. These findings provide insights into the unexpected role of ROCK1 in a signaling cascade that regulates mitochondrial dynamics.


Figures

Figure 1
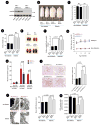
Figure 1. Deletion of ROCK1 Significantly Reduced Albuminuria, and Mesangial Matrix Expansion in the Kidneys of db/db Mice
(A) A representative Western blot confirming deletion of ROCK1 in several tissues in Leprdb/+:ROCK1−/− mice (upper panel). ROCK2 expression levels were unchanged in the same tissues (lower panel). (B) Representative pictures of mice in each group at 24-weeks of age. (C) Systolic blood pressure and body weight (D) were measured in 24-week-old mice in each group. NS: Not significant. (E) Representative images of kidneys obtained from 24 weeks old mice. (F) Kidney weight/body weight ratio in each group. (G) Blood glucose levels in each group. *represents significant statistical differences between diabetics and non-diabetics mice (p<0.01). (H) Urinary albumin excretion was measured at 16-weeks and 24 weeks of age. (I) Representative images of Periodic Acid Schiff (PAS) staining of kidney sections (left panel) (original magnification, x400), and quantification of Mesangial Matrix Index in each group (right panel). (J) Representative electron photomicrographs of glomerular basement membrane (GBM) thickening (left panel), and quantification of GBM thickness in each group (right panel). (K) Podocyte numbers were quantified by assessing nuclear WT1 staining in 50 randomly selected kidney glomeruli per animal in each group. Results are presented as mean±SE (n=5–8/group) in all figures, and analyzed by one-way ANOVA.
Figure 2
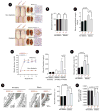
Figure 2. Deletion of ROCK1 Ameliorated Albuminuria in STZ-Induced Diabetic Mice
(A) Representative images of mice (left panel), kidneys (middle panel), and histology (right panel) of non-diabetic and diabetic ROCK1−/− and ROCK1+/+ mice. Histological analysis was assessed by PAS staining (original magnification, x400). (B) Systolic blood pressure and kidney weight/body weight ratio (C) in 24-week-old mice in each group. (D) Blood glucose levels in each group. *represents significant statistical differences between diabetics and non-diabetics mice (p<0.01). (E) Albumin/creatinine ratio was measured in mice after 8 and 16 weeks of persistent hyperglycemia. (F) Mesangial Matrix Index was measured in each group. (G) Representative electron photomicrographs of GBM thickening (left panel), and quantification of GBM thickness in each group (right panel). (H) Podocyte numbers were quantified by assessing nuclear WT1 staining in each group. All data are presented as means ± SEM (n=8–12/each group), and analyzed by one-way ANOVA.
Figure 3
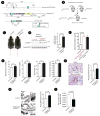
Figure 3. Generation and Initial Characterization of Inducible Podocin Cre cA-ROCK1 Knock-In Mice
(A) The schematic diagram illustrates the ROSA26 targeting locus, cA-ROCK1 targeting construct, and the conditional allele after homologous recombination. The ubiquitin C promoter (UbiC; green arrow) was used to drive constitutively active ROCK1 cDNA (cA-ROCK1; blue arrow) expression. (B) Breeding scheme of bitransgenic podocin Cre cA-ROCK1 mice. (C) Gross appearances of control and inducible podocin Cre cA-ROCK1 knock-in mice. (D) ROCK1 activity in the kidney glomeruli was performed by assessing p-MYPT in podocin Cre cA-ROCK1 knock-in mice (left panel). Quantitation of phospho-myosin phosphatase target subunit 1 (p-MYPT1) in each group (right panel). (E) Albumin/creatinine ratio in podocin Cre cA-ROCK1 knock-in mice at 2 and 5 weeks post tamoxifen injection. (F) Systolic blood pressure, blood glucose, body weights and serum creatinine were assessed in podocin Cre cA-ROCK1 mice. (G) Photomicrographs of PAS staining from glomeruli of podocin Cre cA-ROCK1 (original magnification, x400) (left panel), and quantification of Mesangial Matrix Index in each group (right panel). (H) Representative electron micrographs of kidneys (left panel), and quantification of mean GBM in each group (right panel). Foot processes are indicated by arrows, and effacement of these processes are indicated by asterisks. I) Podocyte numbers were quantified in each group as previously described. All data are presented as means ± SEM (n=4–10/each group), and analyzed by one-way ANOVA.
Figure 4
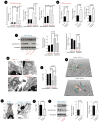
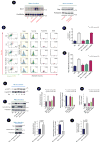
Figure 4. Deletion of ROCK1 Prevents Mitochondrial Fission, mtROS, and Glomerular Apoptosis
(A) Quantitative measurement of superoxide generation in isolated mitochondria from kidney glomeruli by EPR spectroscopy (left panel). Bar graph summarizing the number of apoptotic cells in glomeruli per 50 glomeruli counted in each group (middle panel). Bar graph summarizing caspase-3 activity in kidney glomeruli in different groups (right panel). (B) Quantitative measurement of superoxide generation (left panel), frequency of apoptosis (middle panel), and caspase-3 activity in isolated mitochondria from kidney glomeruli from podocin Cre cA-ROCK1 mice by EPR spectroscopy. (C) Representative Western blots (left panel) and bar graphs of Bax (middle panel) and cytochrome c (right panel)) of mitochondrial fractions obtained from kidney glomeruli in each group. All data are presented as means ± SEM (n=8–12/each group), and analyzed by one-way ANOVA. (D) Representative 2D-EM micrographs of mitochondria in podocytes from each group. (E) Quantification of mitochondrial Aspect ratio in podocytes. A total of 150 mitochondria in each group from 4 different animals were evaluated. (F) Representative 3D-EM images of mitochondria in podocytes from STZ-induced diabetic ROCK+/+ and diabetic ROCK−/− mice. (G) Representative micrographs of mitochondrial morphology in podocytes from a control and a podocin Cre cA-ROCK1 knock-in mouse. (H) Quantification of mitochondrial Aspect ratio from 4G. (I) Representative Western blots of mitochondrial Bax (mtBax) and cytochrome c (left panel) obtained from kidney glomeruli in each group. Quantification of mtBax (middle panel) and cytochrome c (right panel) from three independent experiments. All data are presented as means ± SEM (n=4–10/each group), unless stated otherwise, and analyzed by one-way ANOVA.
Figure 5
Figure 5. ROCK1 Modulates HG-Induced mtROS Production and Podocytes Apoptosis
(A) Representative Western blots of mitochondrial Drp1 from kidney glomeruli obtained from diabetic ROCK1+/+ and ROCK1−/− mice (left panel), and from kidney glomeruli of podocin Cre cA-ROCK1 knock-in mouse (Right panel). (B) Representative histograms of flow cytometry experiments depicting simultaneous detection of apoptosis and mitochondrial superoxide production in live cultured podocytes. The changes in the number of apoptotic cells (% Annexin V-FITC positive), and superoxide production (MitoSOX Red) fluorescence intensity in total (blue), normal (green), apoptotic (purple) and dead (orange) cells are depicted in each condition following HG treatment for 24 hrs. Sc-siRNA: scrambled siRNA. Results are (C) Quantitative data expressing % of Annexin V-FITC positive cells and (D) mean fluorescence intensity of MitoSOX Red in response to HG in different conditions. (E) Representative Western blot of temporal profile of ROCK1 activity in HG (25 mM) treated podocytes. (F) Representative Western blots of mitochondrial Bax and cytochrome c in the cultured mouse podocyte in different conditions. (G) Quantitative analysis of mitochondrial Bax and cytochrome c from three independent experiments. (H) Quantitative changes in caspase-3 activity from three independent experiments. (I) Representative Western blots of mitochondrial Bax and cytochrome c in cA-ROCK1 transfected cultured podocytes. (J) Quantitative changes of caspase-3 activity in cA-ROCK1 transfected podocytes. The data are presented as means ± SEM of at least three independent experiments, unless stated otherwise, and analyzed by one-way ANOVA.
Figure 6
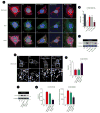
Figure 6. ROCK1 Mediates HG-Induced Mitochondrial Fission
(A) Double immunofluorescence of MitoTracker and Drp1 using deconvolution microscopy. Cells were transfected with scrambled siRNA, si-Drp1, or si-ROCK1. MitoTracker:red; DAPI:blue; Drp1:green, and merge: yellow. Magnification×1000. Scale bars, 5 μm. (B) Mitochondrial morphology was assessed by Aspect ratio analysis. The morphology of at least 120 mitochondria was determined in a triplicate and blinded manner. (C) Representative immunoblot analysis of mitochondrial Drp1 (mtDrp1) in cultured mouse podocytes transfected with si-ROCK1, scrambled (Sc) siRNA, or treated with fasudil (10 μmol/l). (D) Micrographs of mitochondrial morphology visualized by MitoTracker red staining of podocytes transfected with cA-ROCK1, Drp1 shRNA, or scramble shRNA. Scale bars, 15 μm. (E) Mitochondrial morphology was assessed by Aspect ratio from three independent experiments (>100 mitochondria). (F) Representative Western blot of mitochondrial Drp1 (mtDrp1) in cultured mouse podocytes transfected with cA-ROCK1, Drp1 shRNA, or scrambled (sc) shRNA. (G) Quantitative data expressing % of Annexin V-FITC positive cells (left panel) and MitoSOX Red (right panel) in different conditions. In all figures, the means ± SEM of at least three independent experiments and analyzed by one-way ANOVA are shown.
Figure 7
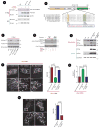
Figure 7. ROCK1 Promotes Mitochondrial Fission via Drp1 Phosphorylation at Ser600
(A) Western blots of immunoprecipitates with anti-Flag antibody (IP) and whole cell lysates (WCL) of ROCK1 and Flag-Drp1 immunoblotted with anti-ROCK1 or anti-Drp1 antibodies in mECs treated with normal glucose (NG, 5 mM) or high glucose (HG, 25 mM) for 1 and 5 hrs. (B) Domain structure of mouse Drp1 isoform b. Sequences from several Drp1 isoforms were aligned to show the conserved motifs for Cdk1/PKCδ phosphorylation (inverted triangle) and PKA/CaMK1α phosphorylation (asterisk) sites. (C) Western blots of phospho-Drp1 (S600 and S579) and total Drp1. D) In vitro kinase assay of bacterially expressed wild-type C-terminal Drp1 (490–699) and its mutant S600A by ROCK1 in the presence of [γ-32P] ATP. Coomassie blue staining of Drp1 was used as the input loading control. (E) Western blots of mitochondrial and cytosolic fractions of Drp1 in mECs following transfection with Flag-Drp1 (wt) or Flag-Drp1 S600A, and exposed to HG (25 mM) for 36 hrs. (F) Micrographs of mitochondrial morphology visualized by MitoTracker red staining of podocytes expressing the indicated shRNAs and the transgenes. Scale bars, 15 μm. The bottom images show magnifications of the areas outlined in the top images. Quantification of mitochondrial Aspect ratio from three independent experiments (>100 mitochondria) (right panel). (G) Quantitative data expressing % of Annexin V-FITC positive cells in different conditions. (H) Mitochondrial morphology was visualized by MitoTracker red staining of podocytes expressing a Flag-wild type Drp1, or Flag Drp1S600D (left panel). The bottom images show magnifications of the areas outlined in the images above. Quantification of mitochondrial Aspect ratio from three independent experiments (>100 mitochondria) (right panel). Results are presented as means ± SEM of at least three independent experiments, and analyzed by one-way ANOVA.

Similar articles

Cited by

References

    1. Brooks C, Wei Q, Cho SG, Dong Z. Regulation of mitochondrial dynamics in acute kidney injury in cell culture and rodent models. J Clin Invest. 2009;119:1275–1285. - PMC - PubMed
    1. Brooks C, Wei Q, Feng L, Dong G, Tao Y, Mei L, Xie ZJ, Dong Z. Bak regulates mitochondrial morphology and pathology during apoptosis by interacting with mitofusins. Proc Natl Acad Sci U S A. 2007;104:11649–11654. - PMC - PubMed
    1. Brownlee M. Biochemistry and molecular cell biology of diabetic complications. Nature. 2001;414:813–820. - PubMed
    1. Chang CR, Blackstone C. Cyclic AMP-dependent protein kinase phosphorylation of Drp1 regulates its GTPase activity and mitochondrial morphology. J Biol Chem. 2007a;282:21583–21587. - PubMed
    1. Chang CR, Blackstone C. Drp1 phosphorylation and mitochondrial regulation. EMBO J. 2007b;8:1088–1089. - PMC - PubMed

Publication types

MeSH terms