

Whole-mount three-dimensional imaging of internally localized immunostained cells within mouse embryos
- PMID: 22322215
- PMCID: PMC3629302
- DOI: 10.1038/nprot.2011.441
Whole-mount three-dimensional imaging of internally localized immunostained cells within mouse embryos
Abstract
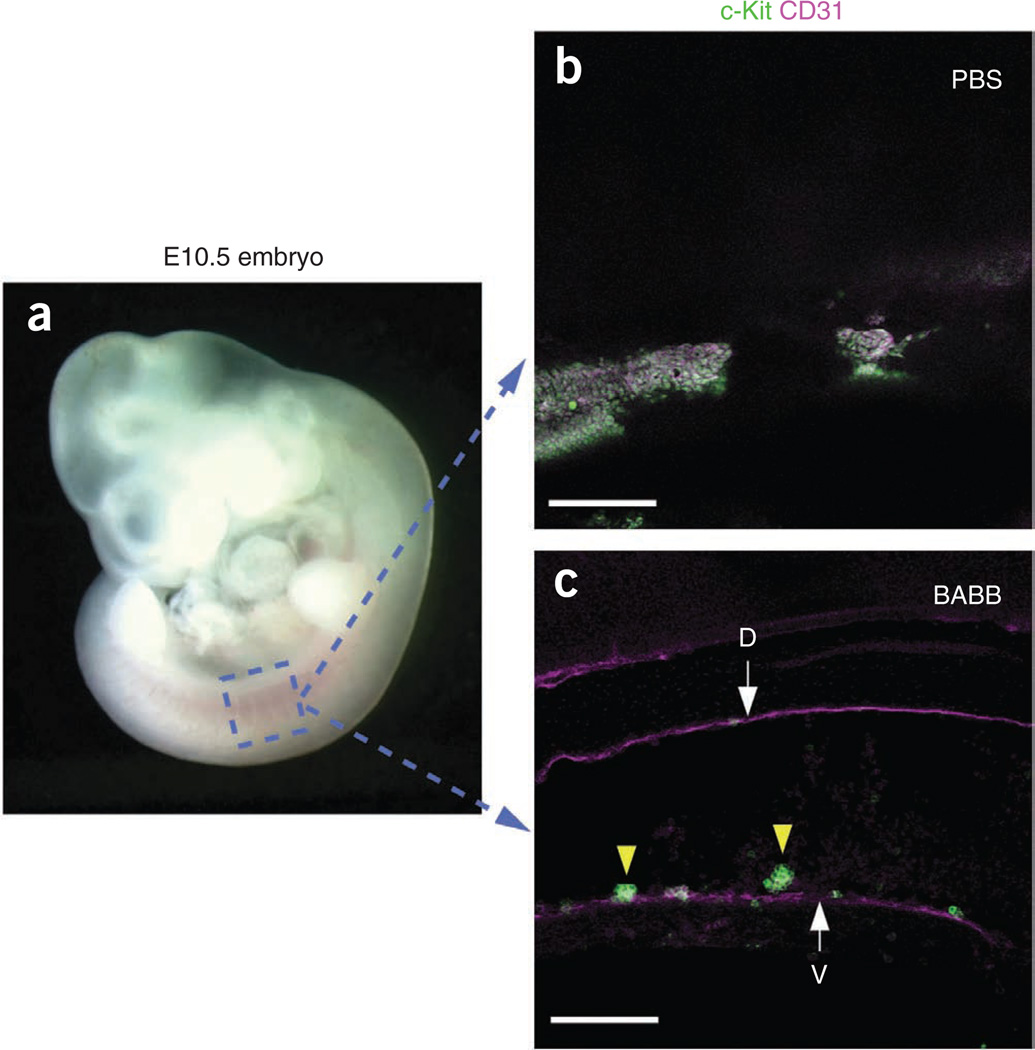
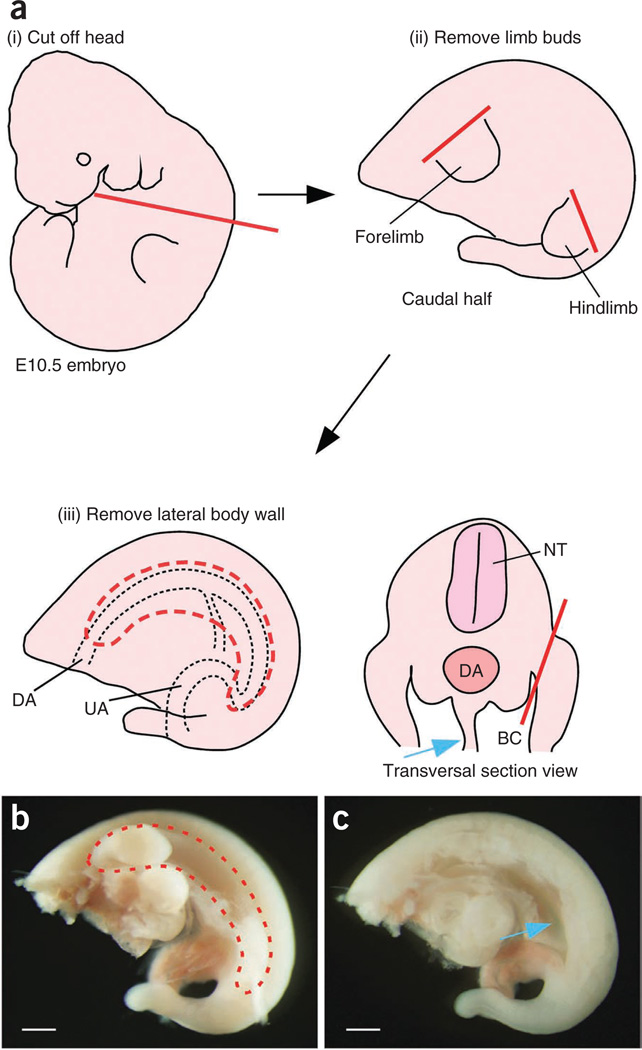
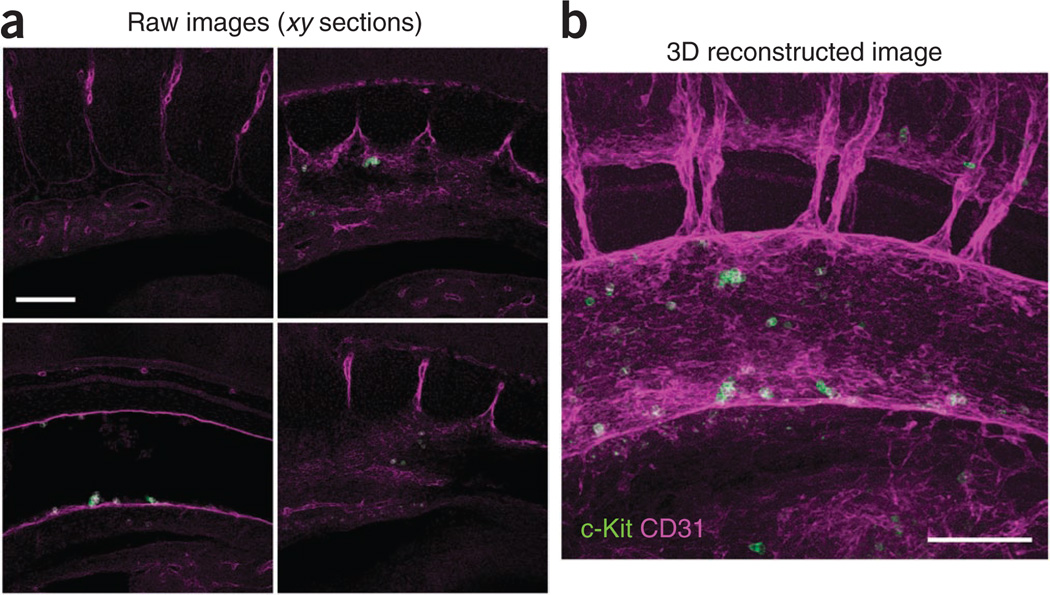
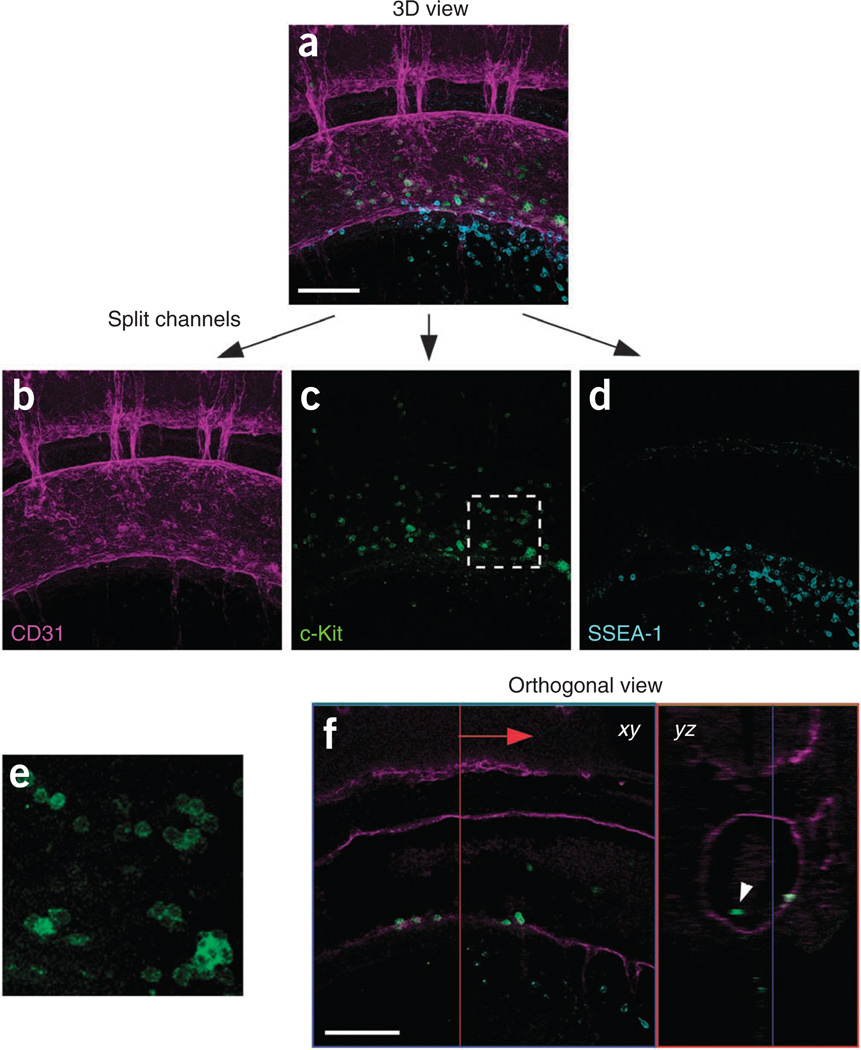
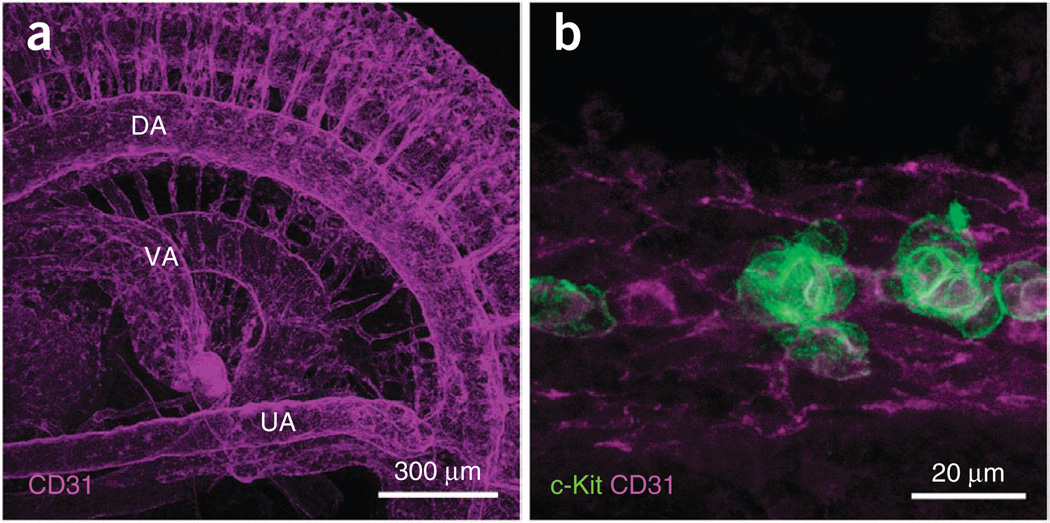
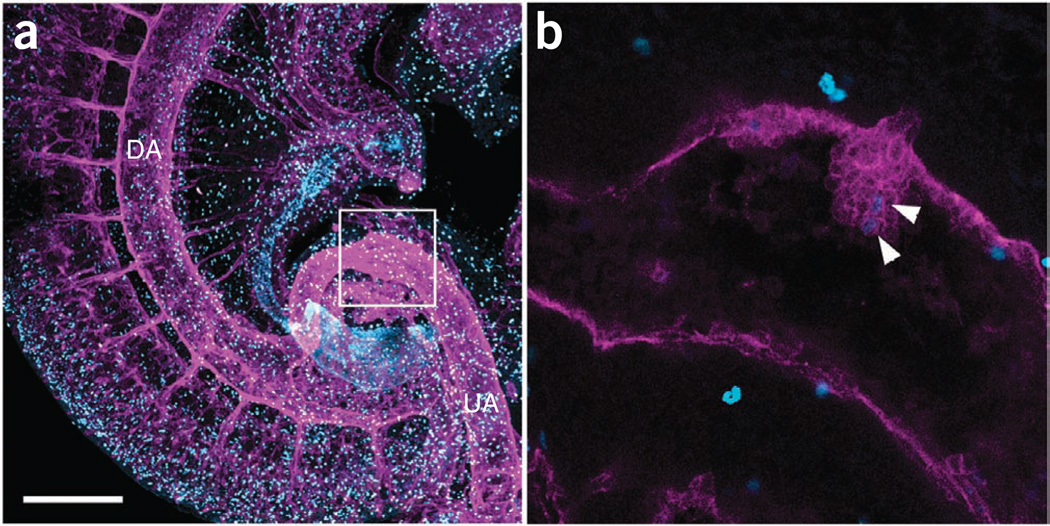
We describe a three-dimensional (3D) confocal imaging technique to characterize and enumerate rare, newly emerging hematopoietic cells located within the vasculature of whole-mount preparations of mouse embryos. However, the methodology is broadly applicable for examining the development and 3D architecture of other tissues. Previously, direct whole-mount imaging has been limited to external tissue layers owing to poor laser penetration of dense, opaque tissue. Our whole-embryo imaging method enables detailed quantitative and qualitative analysis of cells within the dorsal aorta of embryonic day (E) 10.5-11.5 embryos after the removal of only the head and body walls. In this protocol we describe the whole-mount fixation and multimarker staining procedure, the tissue transparency treatment, microscopy and the analysis of resulting images. A typical two-color staining experiment can be performed and analyzed in ∼6 d.
Figures

Similar articles
-
3D structured illumination microscopy of mammalian embryos and spermatozoa.BMC Dev Biol. 2015 Nov 26;15:46. doi: 10.1186/s12861-015-0092-7. BMC Dev Biol. 2015. PMID: 26610350 Free PMC article.
-
Whole mount nuclear fluorescent imaging: convenient documentation of embryo morphology.Genesis. 2012 Nov;50(11):844-50. doi: 10.1002/dvg.22344. Epub 2012 Sep 20. Genesis. 2012. PMID: 22930523 Free PMC article.
-
Ex vivo time-lapse confocal imaging of the mouse embryo aorta.Nat Protoc. 2011 Oct 27;6(11):1792-805. doi: 10.1038/nprot.2011.401. Nat Protoc. 2011. PMID: 22036882
-
Clearing of fixed tissue: a review from a microscopist's perspective.J Biomed Opt. 2016 Aug;21(8):081205. doi: 10.1117/1.JBO.21.8.081205. J Biomed Opt. 2016. PMID: 27020691 Review.
-
Tissue clearing and three-dimensional imaging of intact tissues: a review on FACT protocol.J Histotechnol. 2024 Sep;47(3):126-142. doi: 10.1080/01478885.2024.2352695. Epub 2024 May 16. J Histotechnol. 2024. PMID: 38752929 Review.
Cited by
-
Independent origins of fetal liver haematopoietic stem and progenitor cells.Nature. 2022 Sep;609(7928):779-784. doi: 10.1038/s41586-022-05203-0. Epub 2022 Sep 14. Nature. 2022. PMID: 36104564
-
Human Dupuytren's Ex Vivo Culture for the Study of Myofibroblasts and Extracellular Matrix Interactions.J Vis Exp. 2015 Apr 18;(98):52534. doi: 10.3791/52534. J Vis Exp. 2015. PMID: 25938583 Free PMC article.
-
Coordination of heart and lung co-development by a multipotent cardiopulmonary progenitor.Nature. 2013 Aug 29;500(7464):589-92. doi: 10.1038/nature12358. Epub 2013 Jul 21. Nature. 2013. PMID: 23873040 Free PMC article.
-
Bidirectional crosstalk between the peripheral nervous system and lymphoid tissues/organs.Front Immunol. 2023 Sep 12;14:1254054. doi: 10.3389/fimmu.2023.1254054. eCollection 2023. Front Immunol. 2023. PMID: 37767094 Free PMC article. Review.
-
Inflammatory signaling regulates embryonic hematopoietic stem and progenitor cell production.Genes Dev. 2014 Dec 1;28(23):2597-612. doi: 10.1101/gad.253302.114. Epub 2014 Nov 13. Genes Dev. 2014. PMID: 25395663 Free PMC article.
References
-
- Medvinsky A, Rybtsov S, Taoudi S. Embryonic origin of the adult hematopoietic system: advances and questions. Development. 2011;138:1017–1031. - PubMed
-
- Marshall CJ, Thrasher AJ. The embryonic origins of human haematopoiesis. Br. J. Haematol. 2001;112:838–850. - PubMed
-
- Tavian M, et al. Aorta-associated CD34+ hematopoietic cells in the early human embryo. Blood. 1996;87:67–72. - PubMed
-
- Gard DL. Confocal immunofluorescence microscopy of microtubules in amphibian oocytes and eggs. Methods Cell Biol. 1993;38:241–264. - PubMed
Publication types
MeSH terms
Grants and funding
LinkOut - more resources
Full Text Sources
Other Literature Sources
Medical
