

Absence of HIV-1 evolution in the gut-associated lymphoid tissue from patients on combination antiviral therapy initiated during primary infection
- PMID: 22319447
- PMCID: PMC3271083
- DOI: 10.1371/journal.ppat.1002506
Absence of HIV-1 evolution in the gut-associated lymphoid tissue from patients on combination antiviral therapy initiated during primary infection
Abstract
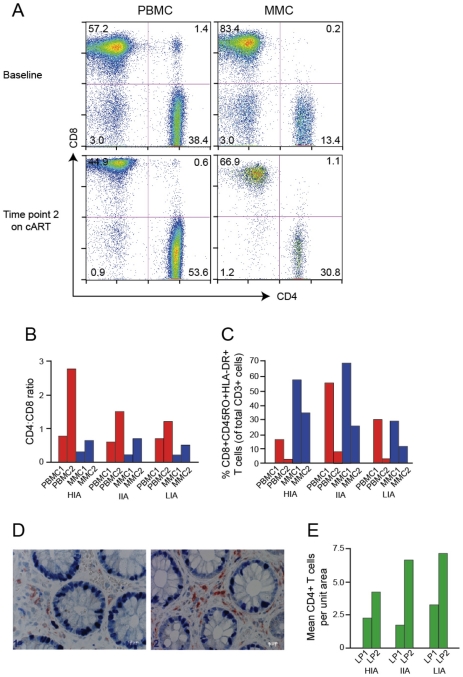
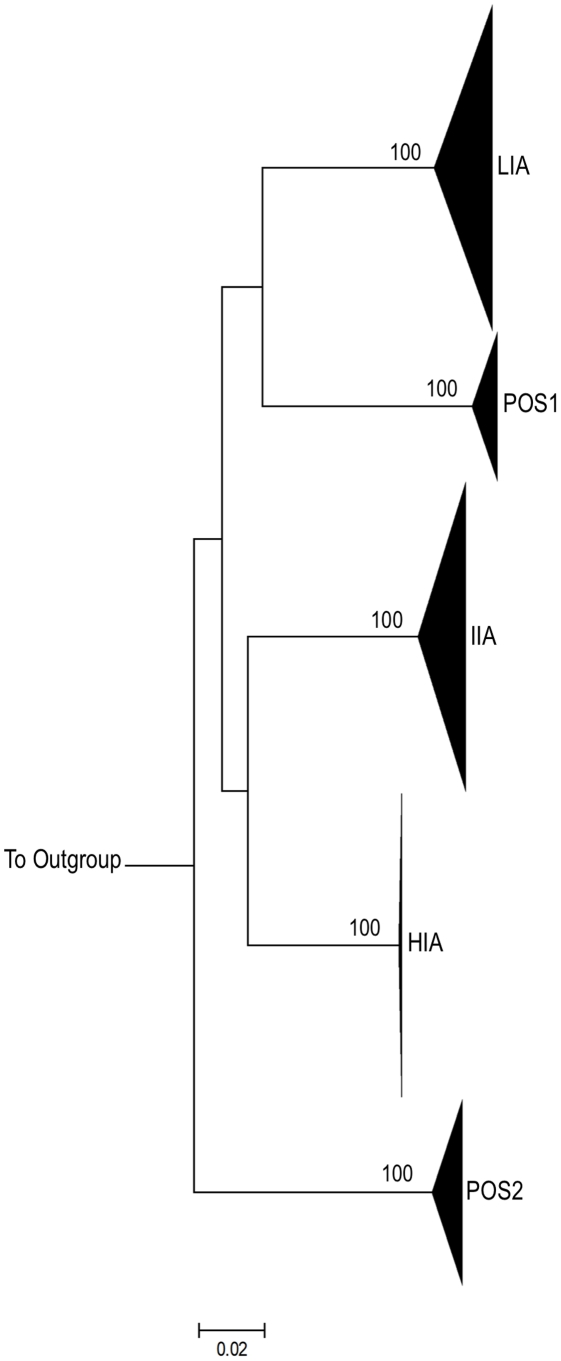
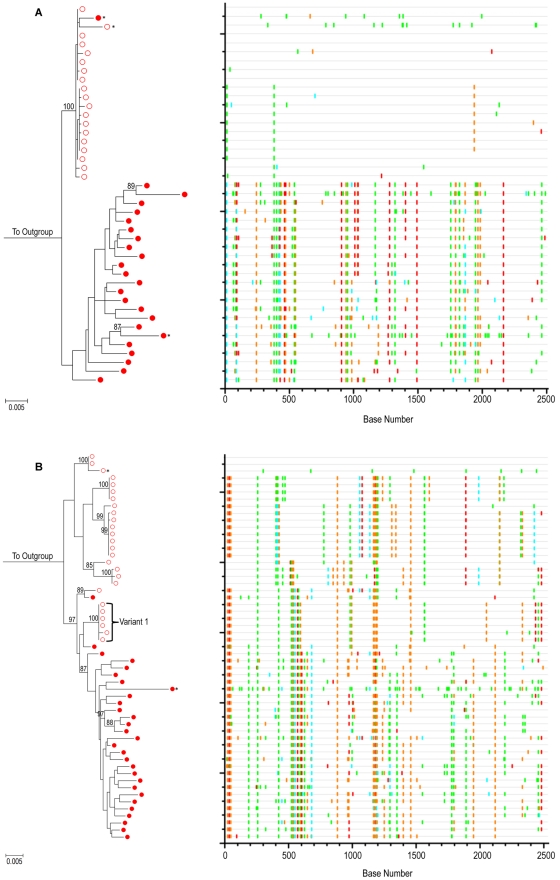
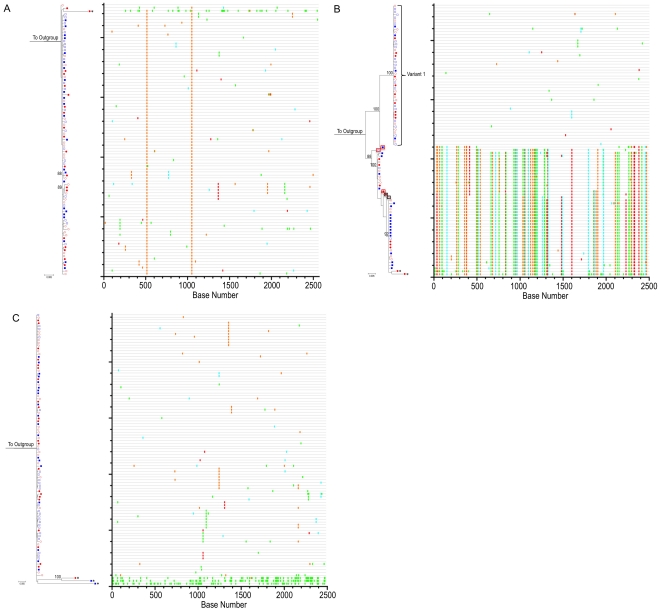
Mucosal mononuclear (MMC) CCR5+CD4+ T cells of the gastrointestinal (GI) tract are selectively infected and depleted during acute HIV-1 infection. Despite early initiation of combination antiretroviral therapy (cART), gut-associated lymphoid tissue (GALT) CD4+ T cell depletion and activation persist in the majority of HIV-1 positive individuals studied. This may result from ongoing HIV-1 replication and T-cell activation despite effective cART. We hypothesized that ongoing viral replication in the GI tract during cART would result in measurable viral evolution, with divergent populations emerging over time. Subjects treated during early HIV-1 infection underwent phlebotomy and flexible sigmoidoscopy with biopsies prior to and 15-24 months post initiation of cART. At the 2(nd) biopsy, three GALT phenotypes were noted, characterized by high, intermediate and low levels of immune activation. A representative case from each phenotype was analyzed. Each subject had plasma HIV-1 RNA levels <50 copies/ml at 2(nd) GI biopsy and CD4+ T cell reconstitution in the peripheral blood. Single genome amplification of full-length HIV-1 envelope was performed for each subject pre- and post-initiation of cART in GALT and PBMC. A total of 280 confirmed single genome sequences (SGS) were analyzed for experimental cases. For each subject, maximum likelihood phylogenetic trees derived from molecular sequence data showed no evidence of evolved forms in the GALT over the study period. During treatment, HIV-1 envelope diversity in GALT-derived SGS did not increase and post-treatment GALT-derived SGS showed no substantial genetic divergence from pre-treatment sequences within transmitted groups. Similar results were obtained from PBMC-derived SGS. Our results reveal that initiation of cART during acute/early HIV-1 infection can result in the interruption of measurable viral evolution in the GALT, suggesting the absence of de-novo rounds of HIV-1 replication in this compartment during suppressive cART.
Conflict of interest statement
MM serves as a paid consultant for Gilead, Tibotec, Merck and ViiV Healthcare/GlaxoSmithKline. He is also a paid speaker for Gilead and Tibotec and receives Research Support from Gilead. The remaining authors have declared that no competing interests exist.
Figures
Similar articles
-
Virologic and immunologic effect of antiretroviral therapy on HIV-1 in gut-associated lymphoid tissue.J Acquir Immune Defic Syndr. 2001 Jan 1;26(1):1-7. doi: 10.1097/00126334-200101010-00001. J Acquir Immune Defic Syndr. 2001. PMID: 11176263 Clinical Trial.
-
The gut mucosal viral reservoir in HIV-infected patients is not the major source of rebound plasma viremia following interruption of highly active antiretroviral therapy.J Virol. 2011 May;85(10):4772-82. doi: 10.1128/JVI.02409-10. Epub 2011 Feb 23. J Virol. 2011. PMID: 21345945 Free PMC article.
-
Severe CD4+ T-cell depletion in gut lymphoid tissue during primary human immunodeficiency virus type 1 infection and substantial delay in restoration following highly active antiretroviral therapy.J Virol. 2003 Nov;77(21):11708-17. doi: 10.1128/jvi.77.21.11708-11717.2003. J Virol. 2003. PMID: 14557656 Free PMC article.
-
Pathogenesis of HIV in the gastrointestinal tract.Curr HIV/AIDS Rep. 2007 Feb;4(1):10-5. doi: 10.1007/s11904-007-0002-0. Curr HIV/AIDS Rep. 2007. PMID: 17338855 Review.
-
[Key role played by the gut associated lymphoid tissue during human immunodeficiency virus infection].Med Sci (Paris). 2015 Dec;31(12):1092-101. doi: 10.1051/medsci/20153112012. Epub 2015 Dec 16. Med Sci (Paris). 2015. PMID: 26672662 Review. French.
Cited by
-
Phylogenetic approach to recover integration dates of latent HIV sequences within-host.Proc Natl Acad Sci U S A. 2018 Sep 18;115(38):E8958-E8967. doi: 10.1073/pnas.1802028115. Epub 2018 Sep 5. Proc Natl Acad Sci U S A. 2018. PMID: 30185556 Free PMC article.
-
The latent reservoir of inducible, infectious HIV-1 does not decrease despite decades of antiretroviral therapy.J Clin Invest. 2023 Sep 1;133(17):e171554. doi: 10.1172/JCI171554. J Clin Invest. 2023. PMID: 37463049 Free PMC article.
-
Linkage of Whole Genome Sequencing, Epidemiological, and Clinical Data to Understand the Genetic Diversity and Clinical Outcomes of Shigella flexneri among Men Who Have Sex with Men in England.Microbiol Spectr. 2021 Dec 22;9(3):e0121321. doi: 10.1128/Spectrum.01213-21. Epub 2021 Dec 15. Microbiol Spectr. 2021. PMID: 34908501 Free PMC article.
-
Expansion of dysfunctional Tim-3-expressing effector memory CD8+ T cells during simian immunodeficiency virus infection in rhesus macaques.J Immunol. 2014 Dec 1;193(11):5576-83. doi: 10.4049/jimmunol.1400961. Epub 2014 Oct 27. J Immunol. 2014. PMID: 25348621 Free PMC article.
-
Clonal Expansion of Human Immunodeficiency Virus-Infected Cells and Human Immunodeficiency Virus Persistence During Antiretroviral Therapy.J Infect Dis. 2017 Mar 15;215(suppl_3):S119-S127. doi: 10.1093/infdis/jiw636. J Infect Dis. 2017. PMID: 28520966 Free PMC article. Review.
References
-
- Mellors JW, Rinaldo CR, Jr, Gupta P, White RM, Todd JA, et al. Prognosis in HIV-1 infection predicted by the quantity of virus in plasma. Science. 1996;272:1167–1170. - PubMed
-
- Daar ES. Virology and immunology of acute HIV type 1 infection. AIDS Res Hum Retroviruses. 1998;14(Suppl 3):S229–234. - PubMed
-
- Rosenberg ES, Altfeld M, Poon SH, Phillips MN, Wilkes BM, et al. Immune control of HIV-1 after early treatment of acute infection. Nature. 2000;407:523–526. - PubMed
-
- Chun TW, Carruth L, Finzi D, Shen X, DiGiuseppe JA, et al. Quantification of latent tissue reservoirs and total body viral load in HIV-1 infection. Nature. 1997;387:183–188. - PubMed
Publication types
MeSH terms
Substances
Grants and funding
LinkOut - more resources
Full Text Sources
Other Literature Sources
Molecular Biology Databases
Research Materials
