. 2012 Mar 30;287(14):11422-36.
doi: 10.1074/jbc.M111.252478. Epub 2012 Feb 8.

Insulin and insulin-like growth factor II differentially regulate endocytic sorting and stability of insulin receptor isoform A

Affiliations

Insulin and insulin-like growth factor II differentially regulate endocytic sorting and stability of insulin receptor isoform A

Alaide Morcavallo et al. J Biol Chem. .

Abstract

The insulin receptor isoform A (IR-A) binds both insulin and insulin-like growth factor (IGF)-II, although the affinity for IGF-II is 3-10-fold lower than insulin depending on a cell and tissue context. Notably, in mouse embryonic fibroblasts lacking the IGF-IR and expressing solely the IR-A (R-/IR-A), IGF-II is a more potent mitogen than insulin. As receptor endocytosis and degradation provide spatial and temporal regulation of signaling events, we hypothesized that insulin and IGF-II could affect IR-A biological responses by differentially regulating IR-A trafficking. Using R-/IR-A cells, we discovered that insulin evoked significant IR-A internalization, a process modestly affected by IGF-II. However, the differential internalization was not due to IR-A ubiquitination. Notably, prolonged stimulation of R-/IR-A cells with insulin, but not with IGF-II, targeted the receptor to a degradative pathway. Similarly, the docking protein insulin receptor substrate 1 (IRS-1) was down-regulated after prolonged insulin but not IGF-II exposure. Similar results were also obtained in experiments using [NMeTyr(B26)]-insulin, an insulin analog with IR-A binding affinity similar to IGF-II. Finally, we discovered that IR-A was internalized through clathrin-dependent and -independent pathways, which differentially regulated the activation of downstream effectors. Collectively, our results suggest that a lower affinity of IGF-II for the IR-A promotes lower IR-A phosphorylation and activation of early downstream effectors vis à vis insulin but may protect IR-A and IRS-1 from down-regulation thereby evoking sustained and robust mitogenic stimuli.


Figures
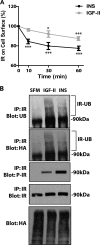
FIGURE 1.
FIGURE 1.
Insulin and IGF-II differentially affect IR-A internalization despite promoting similar levels of IR-A ubiquitination. A, the level of IR-A internalization in R−/IR-A cells was determined by ELISA at different time points after insulin (INS) and IGF-II stimulation, as described under “Experimental Procedures.” Ligands were used at 200 ng/ml to ensure saturating concentrations. Data are the average ± S.D. of three independent experiments. Statistical significance was determined using Student's t test for repeated measures, *, p < 0.05; ***, p < 0.01 (INS or IGF-II versus SFM) and using two-way ANOVA with Bonferroni's multiple comparison test, p < 0.01 (INS versus IGF-II). B, ligand-dependent ubiquitination of the IR-A in R−/IRA cells was assessed as described under “Experimental Procedures” and in previous work from our laboratories (17, 18). The experiment shown is representative of three independent experiments.
FIGURE 2.
FIGURE 2.
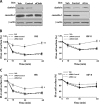
Ligand affinity for the IR-A modulates cell growth and internalization. A, growth curve experiments were performed as previously described from our laboratories (7, 11, 19). Cells were counted in Boyden chambers after 48 h and values are expressed as % increase over SFM. Data are the averages ± S.D. of three independent experiments. Statistical significance was determined using two-way ANOVA: p < 0.02, insulin versus IGF-II stimulation curve; p < 0.05, insulin versus [NMeTyrB26]-insulin stimulation curve. B–D, the level of IR-A internalization in R−/IR-A cells was determined by ELISA at different time points after insulin (INS), IGF-II, or [NMeTyrB26]-insulin stimulation, as described under “Experimental Procedures.” Data are the averages ± S.D. of three independent experiments. Statistical significance was determined using Student's t test for repeated measures, *, p < 0.05; **, p < 0.01 (INS, IGF-II or [NMeTyrB26]-insulin versus SFM) and using two-way ANOVA with Bonferroni's multiple comparison test, *, p < 0.05; **, p < 0.01 (INS versus IGF-II or [NMeTyrB26]-insulin).
FIGURE 3.
FIGURE 3.
Insulin and IGF-II differ in their ability to regulate IR-A and IRS-1 stability. A, R−/IR-A cells were serum starved for 24 h and then stimulated with 50 ng/ml of insulin (INS) or IGF-II for the indicated time points. Proteins levels were determined by immunoblot analysis with specific polyclonal antibodies, as described under “Experimental Procedures.” B, serum-starved R−/IR-A cells were stimulated at the different time points with insulin and IGF-II (50 ng/ml). Serine phosphorylation of IRS-1 was determined by immunoblot using phospho-specific antibodies for Ser307. Total IRS-1 was assessed using anti-IRS-1 polyclonal antibodies. Densitometric analysis is expressed as arbitrary units. B, serine phosphorylation of IRS-1 was assessed by immunoblot using phospho-specific antibodies for serine 307. Blots are representative of three independent experiments. C and D, to assess the stability of the IR-A in the presence of specific inhibitors for either the proteasomal or lysosomal pathway, serum-starved R−/IR-A cells were stimulated for 24 h with 50 ng/ml of insulin (INS) (C) or IGF-II (D) alone or supplemented with 20 μm MG132 (MG) or 100 μm leupeptin/pepstatin (Leu/Pep). IR levels were assessed by immunoblot. The total amount of protein loaded on the gel was monitored using anti-β-actin polyclonal antibodies (A–E). Quantification was performed by densitometry using NIH ImageJ software. The data are presented as mean ± S.D. Statistical significance was determined using two-way ANOVA with Bonferroni's multiple-comparison test. ***, p < 0.001; **, p < 0.01; *, p < 0.05.
FIGURE 4.
FIGURE 4.
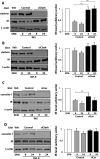
Depletion of endogenous clathrin and caveolin-1 inhibits ligand-dependent internalization of the IR-A. A, gene knockdown for clathrin and caveolin-1 in R−/IR-A cells was achieved by siRNA. Level of clathrin and caveolin-1 in vehicle (Veh), control oligo (Control), and siRNA-treated (siClath or siCav) cells were assessed by immunoblot using anti-clathrin- and anti-caveolin-1-specific polyclonal antibodies. Total protein load was assessed using anti-β-actin polyclonal antibodies. Blots are representative of three independent experiments. Insulin and IGF-II-mediated internalization of the IR-A in R-IR-A cells depleted of endogenous clathrin (B) or caveolin-1 (C) was assessed by ELISA 72 h post-transfection. The data are presented as mean ± S.D. of three independent experiments. Statistical significance was determined using two-way ANOVA with Bonferroni's multiple comparison test. **, p < 0.01; *, p < 0.05 (siRNAs versus oligo-control-treated cells).
FIGURE 5.
FIGURE 5.
Clathrin-dependent endocytosis is required for insulin-induced IR-A degradation. Gene knockdown for clathrin and caveolin-1 in R−/IR-A cells was achieved by siRNAs. IR-A levels were determined in clathrin-depleted (A and B) or caveolin-1-depleted (C and D) R−/IR-A cells by immunoblot after stimulation with insulin or IGF-II for 8 and 24 h. IR-A, clathrin, and caveolin-1 expression was assessed using anti-IR (A–D), anti-clathrin (A), and anti-caveolin-1 (B) polyclonal antibodies. Protein load was assessed using anti-β-actin polyclonal antibodies. Results are expressed as average ± S.D. of three independent experiments. Statistical significance was determined using two-way ANOVA with Bonferroni's multiple comparison test. **, p < 0.01.
FIGURE 6.
FIGURE 6.
Insulin and IGF-II induce different sorting of the IR-A. R−/IR cells were plated onto coverslips and serum starved for 24 h. Cells were then stimulated with 200 ng/ml of either insulin or IGF-II for the indicated time points. Co-localization of the IR-A with either EEA1 (A) or LAMP-1 (B) was assessed by confocal microscopy, as described under “Experimental Procedures.” Insets represent enlarged views (×3) of the boxed regions. Insets include arrows that point to single isolated dots where colocalization between the IR-A and either EEA1 or LAMP-1 is evident. Images were collected on a Leica TCS-SP2 confocal microscope (Leica Microsystems) with a ×63 Apo PLA oil immersion objective (NA 1.4) and 60-μm aperture using LEICA Scan TCS-SP2 software (Leica Microsystems). Images were merged using Photoshop 6. Pictures are representative of at least 10 independent fields from three independent experiments. Fields were selected for the presence of cells with the following criteria: well defined limits, clear identification of nucleus, and absence of intersection with neighboring cells. An average of 300 cells was examined for each condition. Data are representative of ∼90% of the total number of cells examined.
FIGURE 7.
FIGURE 7.
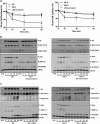
Pharmacological inhibition of clathrin-dependent and -independent endocytosis pathways blocks IR-A internalization and regulates IR-A signaling. A, the level of IR-A internalization in R−/IR cells was determined by ELISA. Cells were serum starved for 24 h, pre-treated with 10 mm of methyl-β-cyclodextrin for 1 h, and then stimulated with 200 ng/ml of insulin (INS), IGF-II, or [NMeTyrB26]-insulin alone or supplemented with methyl-β-cyclodextrin. Data are the average ± S.D. of three independent experiments carried out in quadruplicate. Statistical significance was determined using two-way ANOVA, ***, p < 0.0001 (INS versus INS + methyl-β-cyclodextrin and [NMeTyrB26]-insulin versus [NMeTyrB26]-insulin + methyl-β-cyclodextrin); **, p < 0.005 (IGF-II versus IGF-II + methyl-β-cyclodextrin). B, cells were serum starved for 24 h, pre-treated in SFM alone, or supplemented with 10 mm methyl-β-cyclodextrin for 1 h and then stimulated with 50 ng/ml of insulin (INS), IGF-II, or [NMeTyrB26]-insulin alone or supplemented with methyl-β-cyclodextrin for the indicated time points. Effect of methyl-β-cyclodextrin on insulin and IGF-II-dependent IR-A, IRS-1, Akt, ERK1/2, and p70 S6K phosphorylation was assessed by immunoblot using phospho-specific antibodies as described under “Experimental Procedures.” Blots are representative of three independent experiments.
FIGURE 8.
FIGURE 8.
Pharmacological inhibition of either clathrin-dependent or -independent endocytosis blocks IR-A internalization and specifically affects IR-A signaling. A, R−/IR-A cells were serum starved for 24 h, pre-treated for 1 h with either 1 μg/ml of filipin or 15 μm chlorpromazine, and then stimulated with 200 ng/ml of insulin (INS) or IGF-II alone or in the presence of the specific inhibitors. IR-A internalization was determined by ELISA. Data are the average ± S.D. of three independent experiments carried out in quadruplicates. Statistical significance was determined using Student's t test for repeated measures, *, p < 0.05 (INS versus INS + filipin; INS versus INS + chlorpromazine); *, p < 0.05 (IGF-II versus IGF-II + filipin; IGF-II versus IGF-II + chlorpromazine). B and C, cells were serum-starved for 24 h, pretreated for 1 h in SFM alone, or supplemented with either 1 μg/ml of filipin or 15 μm chlorpromazine and then stimulated with 200 ng/ml of insulin (INS) or IGF-II alone or in the presence of the specific inhibitors. B, effect of chlorpromazine, and C, filipin on insulin and IGF-II-dependent IR-A, IRS-1, Akt, ERK1/2, and p70 S6K phosphorylation was assessed by immunoblot using phosphospecific antibodies. Blots are representative of three independent experiments.

Similar articles

Cited by

References

    1. Seino S., Bell G. I. (1989) Alternative splicing of human insulin receptor messenger RNA. Biochem. Biophys. Res. Commun. 159, 312–316 - PubMed
    1. Mosthaf L., Grako K., Dull T. J., Coussens L., Ullrich A., McClain D. A. (1990) Functionally distinct insulin receptors generated by tissue-specific alternative splicing. EMBO J. 9, 2409–2413 - PMC - PubMed
    1. Papa V., Gliozzo B., Clark G. M., McGuire W. L., Moore D., Fujita-Yamaguchi Y., Vigneri R., Goldfine I. D., Pezzino V. (1993) Insulin-like growth factor-I receptors are overexpressed and predict a low risk in human breast cancer. Cancer Res. 53, 3736–3740 - PubMed
    1. Yamaguchi Y., Flier J. S., Benecke H., Ransil B. J., Moller D. E. (1993) Ligand-binding properties of the two isoforms of the human insulin receptor. Endocrinology 132, 1132–1138 - PubMed
    1. Kosaki A., Webster N. J. (1993) Effect of dexamethasone on the alternative splicing of the insulin receptor mRNA and insulin action in HepG2 hepatoma cells. J. Biol. Chem. 268, 21990–21996 - PubMed

Publication types