

Cardiac lineage protein-1 (CLP-1) regulates cardiac remodeling via transcriptional modulation of diverse hypertrophic and fibrotic responses and angiotensin II-transforming growth factor β (TGF-β1) signaling axis
- PMID: 22308025
- PMCID: PMC3339995
- DOI: 10.1074/jbc.M111.288944
Cardiac lineage protein-1 (CLP-1) regulates cardiac remodeling via transcriptional modulation of diverse hypertrophic and fibrotic responses and angiotensin II-transforming growth factor β (TGF-β1) signaling axis
Abstract
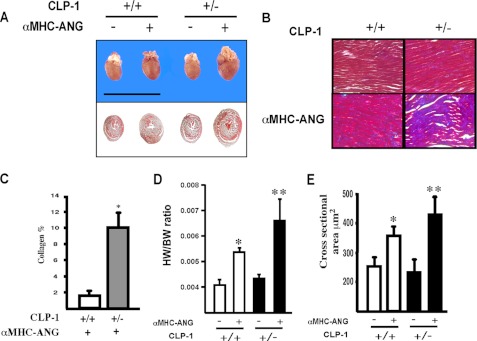
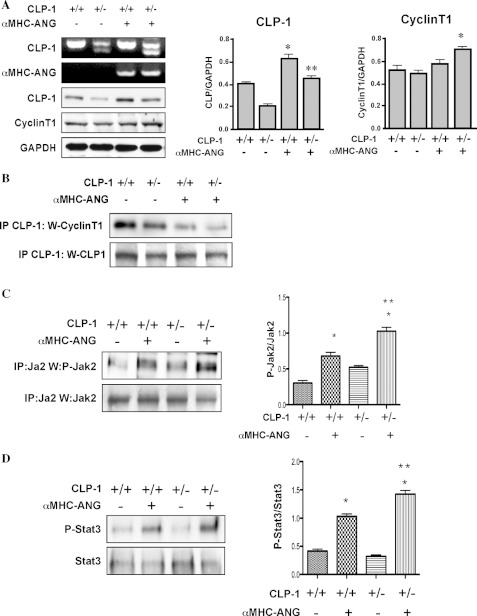
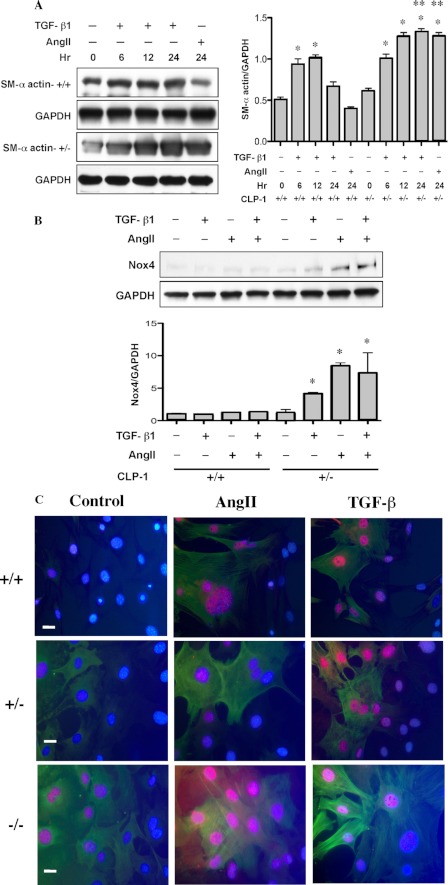
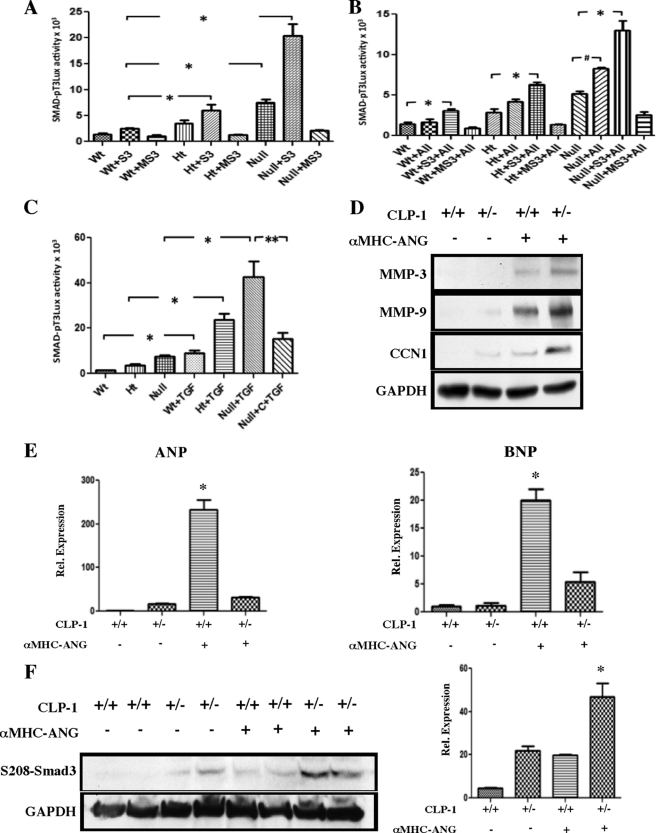
It is well known that the renin-angiotensin system contributes to left ventricular hypertrophy and fibrosis, a major determinant of myocardial stiffness. TGF-β1 and renin-angiotensin system signaling alters the fibroblast phenotype by promoting its differentiation into morphologically distinct pathological myofibroblasts, which potentiates collagen synthesis and fibrosis and causes enhanced extracellular matrix deposition. However, the atrial natriuretic peptide, which is induced during left ventricular hypertrophy, plays an anti-fibrogenic and anti-hypertrophic role by blocking, among others, the TGF-β-induced nuclear localization of Smads. It is not clear how the hypertrophic and fibrotic responses are transcriptionally regulated. CLP-1, the mouse homolog of human hexamethylene bis-acetamide inducible-1 (HEXIM-1), regulates the pTEFb activity via direct association with pTEFb causing inhibition of the Cdk9-mediated serine 2 phosphorylation in the carboxyl-terminal domain of RNA polymerase II. It was recently reported that the serine kinase activity of Cdk9 not only targets RNA polymerase II but also the conserved serine residues of the polylinker region in Smad3, suggesting that CLP-1-mediated changes in pTEFb activity may trigger Cdk9-dependent Smad3 signaling that can modulate collagen expression and fibrosis. In this study, we evaluated the role of CLP-1 in vivo in induction of left ventricular hypertrophy in angiotensinogen-overexpressing transgenic mice harboring CLP-1 heterozygosity. We observed that introduction of CLP-1 haplodeficiency in the transgenic α-myosin heavy chain-angiotensinogen mice causes prominent changes in hypertrophic and fibrotic responses accompanied by augmentation of Smad3/Stat3 signaling. Together, our findings underscore the critical role of CLP-1 in remodeling of the genetic response during hypertrophy and fibrosis.
Figures
Similar articles
-
DKK3 overexpression attenuates cardiac hypertrophy and fibrosis in an angiotensin-perfused animal model by regulating the ADAM17/ACE2 and GSK-3β/β-catenin pathways.J Mol Cell Cardiol. 2018 Jan;114:243-252. doi: 10.1016/j.yjmcc.2017.11.018. Epub 2017 Dec 5. J Mol Cell Cardiol. 2018. PMID: 29196099
-
Klotho inhibits angiotensin II-induced cardiac hypertrophy, fibrosis, and dysfunction in mice through suppression of transforming growth factor-β1 signaling pathway.Eur J Pharmacol. 2019 Sep 15;859:172549. doi: 10.1016/j.ejphar.2019.172549. Epub 2019 Jul 17. Eur J Pharmacol. 2019. PMID: 31325434
-
EphrinB2 Regulates Cardiac Fibrosis Through Modulating the Interaction of Stat3 and TGF-β/Smad3 Signaling.Circ Res. 2017 Sep 1;121(6):617-627. doi: 10.1161/CIRCRESAHA.117.311045. Epub 2017 Jul 25. Circ Res. 2017. PMID: 28743805
-
TGF-beta1 and angiotensin networking in cardiac remodeling.Cardiovasc Res. 2004 Aug 15;63(3):423-32. doi: 10.1016/j.cardiores.2004.04.030. Cardiovasc Res. 2004. PMID: 15276467 Review.
-
Role of transforming growth factor-beta in the progression of heart failure.Cell Mol Life Sci. 2006 Nov;63(22):2584-96. doi: 10.1007/s00018-006-6085-8. Cell Mol Life Sci. 2006. PMID: 17013566 Free PMC article. Review.
Cited by
-
Functional Interaction between HEXIM and Hedgehog Signaling during Drosophila Wing Development.PLoS One. 2016 May 13;11(5):e0155438. doi: 10.1371/journal.pone.0155438. eCollection 2016. PLoS One. 2016. PMID: 27176767 Free PMC article.
-
Hexim1, a Novel Regulator of Leptin Function, Modulates Obesity and Glucose Disposal.Mol Endocrinol. 2016 Mar;30(3):314-24. doi: 10.1210/me.2015-1211. Epub 2016 Feb 9. Mol Endocrinol. 2016. PMID: 26859361 Free PMC article.
-
Effects of endometrial stem cell transplantation combined with estrogen in the repair of endometrial injury.Oncol Lett. 2018 Jul;16(1):1115-1122. doi: 10.3892/ol.2018.8702. Epub 2018 May 11. Oncol Lett. 2018. PMID: 29963188 Free PMC article.
-
Autonomic boundary conditions for ventricular fibrillation and their implications for a novel defibrillation technique.J Physiol Sci. 2012 Nov;62(6):479-92. doi: 10.1007/s12576-012-0225-8. Epub 2012 Aug 15. J Physiol Sci. 2012. PMID: 22893479 Free PMC article.
-
Activation of P-TEFb by cAMP-PKA signaling in autosomal dominant polycystic kidney disease.Sci Adv. 2019 Jun 5;5(6):eaaw3593. doi: 10.1126/sciadv.aaw3593. eCollection 2019 Jun. Sci Adv. 2019. PMID: 31183407 Free PMC article.
References
-
- Schnee J. M., Hsueh W. A. (2000) Angiotensin II, adhesion, and cardiac fibrosis. Cardiovasc. Res. 46, 264–268 - PubMed
-
- Re R. N., Cook J. L. (2007) Mechanisms of disease. Intracrine physiology in the cardiovascular system. Nat. Clin. Pract. Cardiovasc. Med. 4, 549–557 - PubMed
-
- Schmierer B., Hill C. S. (2007) TGF-β-SMAD signal transduction. Molecular specificity and functional flexibility. Nat. Rev. Mol. Cell Biol. 8, 970–982 - PubMed
-
- Shi Y., Massagué J. (2003) Mechanisms of TGF-β signaling from cell membrane to the nucleus. Cell 113, 685–700 - PubMed
Publication types
MeSH terms
Substances
Grants and funding
LinkOut - more resources
Full Text Sources
Molecular Biology Databases
Research Materials
Miscellaneous
