. 2012 Feb 3;10(2):183-97.
doi: 10.1016/j.stem.2011.12.018.

A mammary stem cell population identified and characterized in late embryogenesis reveals similarities to human breast cancer

Affiliations

A mammary stem cell population identified and characterized in late embryogenesis reveals similarities to human breast cancer

Benjamin T Spike et al. Cell Stem Cell. .

Abstract

Gene expression signatures relating mammary stem cell populations to breast cancers have focused on adult tissue. Here, we identify, isolate, and characterize the fetal mammary stem cell (fMaSC) state since the invasive and proliferative processes of mammogenesis resemble phases of cancer progression. fMaSC frequency peaks late in embryogenesis, enabling more extensive stem cell purification than achieved with adult tissue. fMaSCs are self-renewing, multipotent, and coexpress multiple mammary lineage markers. Gene expression, transplantation, and in vitro analyses reveal putative autocrine and paracrine regulatory mechanisms, including ErbB and FGF signaling pathways impinging on fMaSC growth. Expression profiles from fMaSCs and associated stroma exhibit significant similarities to basal-like and Her2+ intrinsic breast cancer subtypes. Our results reveal links between development and cancer and provide resources to identify new candidates for diagnosis, prognosis, and therapy.


Figures

Figure 1
Figure 1
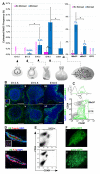
fMaSCs identified in late embryogenesis express high levels of CD24 and CD49f. (A) Mammary stem cell frequency estimates at various stages of fetal development and in the adult in the presence or absence of Matrigel. Gross morphological appearance of the gland at various stages is illustrated. e=epithelium, m=mesenchyme and fp=fat pad. *p < 0.001, pairwise group difference. Error bars, 95% confidence interval. (B) Confocal images showing CD49f (i-iii) and CD24 (iv-vi) expression in whole mounts at E13.5, E15.5 and E18.5. (C) Histogram and FACS contour plot showing the distribution of cells expressing CD24 and CD49f in the LIN population (DAPICD31CD45TER119) in mammary glands from a nulliparous adult mouse (black) and actin-eGFP E18.5 female embryos (green). Adult eGFP mammary and eGFP+ E18.5 fetal mammary cell suspensions were mixed, co-stained and analyzed together. (D) Immunofluorescence analysis of paraffin sections of a regenerated mammary gland from a parous recipient showing Casein/K8 (i) and K14/K8 (ii). Inset, secondary antibody control. (E) Representative FACS dot plots showing very similar patterns of expression of CD24 and CD49f in viable lineage depleted mammary cells from a nulliparous adult mouse (top panel) and from a mammary gland regenerated by the fMaSCs (bottom panel). (F) Representative whole mount of actin-eGFP mammary outgrowth arising from transplantation of the fMaSC population (LinCD24highCD49fhigh) isolated from E18.5 embryos. The mammary glands were harvested from primary (i) and secondary (ii) recipients 12 weeks after transplantation. See also Table 1, S1 and Figure S1.
Figure 2
Figure 2
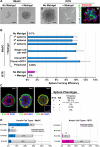
Individual cells from the fMaSC population generate clonal, multi-lineage spheres that can be serially propagated, and co-express markers of multiple lineages. (A) Morphology of structures generated from fMaSC (i) and fSTR (ii) populations grown under non-adherent conditions in vitro, in the presence and absence of Matrigel. (iii) Confocal image of an fSTR polyclonal sphere derived by mixing fSTR cells from WT and actin-eGFP transgenic embryos showing Vimentin immunofluorescence (red), nuclear counterstain DAPI (blue), and actin-eGFP (green). Scale bar, 50μm. (B) Quantification of clonal, primary fMaSC-derived sphere growth, secondary and tertiary sphere growth, and fSTR-derived sphere growth. Error bars, standard deviation. (C) Confocal immunofluorescence analysis of spheres derived from the fMaSC population showing the expression of K8 (red), K14 (green) or both (yellow) with nuclear counterstain DAPI (blue) and tabular summary of sphere types observed. Type 1 spheres consist of cells expressing either K14 (i.e. sphere periphery) or K8 (i.e. middle of the sphere), while type 2 spheres consist mainly of cells co-expressing K8 and K14 (yellow cells). Inset, secondary antibody control. Scale bars, 25μm. Inset, secondary antibody control. Scale bars, 50μm. (D) Summary of the percentage of cells in the fMaSC and fSTR populations expressing K8, K14, and/or Vimentin. Error bars, standard deviation. See also Figure S2.
Figure 3
Figure 3
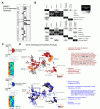
Differential gene expression profiling of fMaSC, fSTR and aMaSC populations. (A) Illustration of sorted populations, Pearson correlation among biological replicates for each cell type and heat maps illustrating the identification of differentially expressed genes (SAM; FDR<10%). (B) qRT-PCR analysis of select stem cell and developmental genes in the fMaSC population relative to fSTR. (C) Expression levels of a representative selection of genes determined by microarray and by qRT-PCR. The expression level in the fMaSC relative to the fSTR is plotted as the fold difference in expression. Fold differences in gene expression were calculated for RT-PCR assuming ideal amplification (fold change = 2ΔCt) and for Nimblegen array data using the normalized probe intensities (fold change = ΔLog2(intensity)). Data were normalized to HPRT. Despite differences in the dynamic range of the two techniques, the pattern of differential expression between the fMaSC and fSTR determined by array was consistent with the pattern determined by qRT-PCR. (D) Microfluidics-based, single-cell, qRT-PCR analyses of cells from the fMaSC population. Right panel, examples of single cells co-expressing various keratins and the mesenchymal marker, vimentin. See also Table S4.
Figure 4
Figure 4
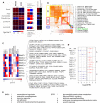
Unique gene content in the E18.5 fetal mammary. (A) qRT-PCR analysis of select stem cell and developmental genes in fMaSC relative to E15.5 mammary rudiment. (B) Overlap of fMaSC signature genes and their orthologues with previously reported normal adult mammary signatures. The upper panel shows mouse signatures (Lim et al., 2009; Pece et al., 2010). The lower panel shows hMaSC and hStromal signatures (Lim et al., 2010), and a signature from cultured hMaSCs (Lim et al., 2009; Pece et al., 2010); p-values represent the hypergeometric probability based on all 20,309 probes in the mouse array and 19,828 probes in the human arrays. (C) Identification of genes unique to fMaSC and fSTR populations (Venn diagrams) and clustering of expression array data for these genes for fMaSC (f), fSTR (s), aMaSC (a), E15.5 mammary rudiments (b, “buds”), and Lineage depleted adult mammary epithelium (e) (heat maps). (D) Gene ontology enrichment analysis of genes unique to the fMaSC and fSTR signatures. Each globe represents an ontological category and the size of the globe represents the number of genes in the category. Significantly enriched categories are color coded in red for fMaSC and blue for fSTR (Benjamini-Hochberg adjusted FDR=5%). The organic layout algorithm used (Cytoscape), allows visualization of dense ontological data and the observation that many categories are enriched for each signature type. The most highly enriched categories are color coded in orange and the categories with the lowest p-values including, gene names contributing to the most enriched ‘biological process’ for each population, is listed to the right. See also Figure S4 and Table S4,S5.
Figure 5
Figure 5
Prediction and validation of non-autonomous signaling in fMaSC function. (A) A model constructed from fetal gene signatures filtered for receptors and ligands using the GeneGo pathway analysis platform. The model illustrates candidate protein-protein interactions including receptor-ligand pairs expressed reciprocally in the fMaSC (left) and fSTR (right) populations. Additional gene products of interest predicted to interact with the network are also indicated (gray). The map suggests that ErbB signaling, among other pathways, may play a prominent role in fMaSC function. (B) Quantification of fMaSC-derived spheres in the absence and presence of growth factors suggested by the model in A. (C) Quantification of fMaSC-derived sphere growth upon inhibition of ErbB1/2 signaling by either Lapatinib or inhibition of ErbB1/2/4 signaling by Neratinib. *p < 0.05, Student’s t test. (D) Dose response curves to Lapatinib and Neratinib in resistant human BT549 and sensitive MCF10A/HER2 cell lines (Wang et al., 2006; Weigelt et al., 2010). All error bars, standard deviation. See also Figure S5.
Figure 6
Figure 6
Fetal mammary gene expression patterns provide molecular links to human breast cancers. (A) Significant correlation between fMaSC and fSTR gene signatures and human breast cancers (n=337) (Prat et al., 2010) are indicated by horizontal bars, each representing the gene expression profile from an individual tumor sample. Red bars indicate tumors enriched in fetal signature expression, blue bars indicate signature repression. Black bars indicate no significant correlation. Larger colored squares illustrate the trend for each intrinsic subtype. For comparison, a randomized signature of equivalent size and a proliferation signature (Ben-Porath et al., 2008) are shown. (B) A comparison of several signatures and clinical metrics by significance of gene overlap. Most signatures are closely related and are significantly associated with ER (yellow box) or Proliferation (AURKA; red box) related signatures. Because of its size, the small OncotypeDX signature shows modest significance values for the proliferation group, although it includes several proliferation ER and Her2 related genes. The fMaSC signature (green box and arrows) is relatively unique showing no significant overlap with proliferation or ErbB2/Her2 related signatures (blue) and relatively low association with ER related signatures. (C) Significance of enrichment for sub-signatures among diverse breast cancers in a large microarray compendium (n=1211) (Ben-Porath et al., 2008). Enrichments according to subtype and grade are indicated by colored squares that represent probabilities for the percentage of tumors enriched or repressed in each annotation group. Genes comprising each sub-signature are listed. (D) Sub-signatures showing significance in multivariate analysis (p<0.1) are graphed for models including the following categorical clinical variables: A: ER status, Grade, Lymph-node status, Tumor size; B: Grade, Lymph-node status and Tumor size; C: ER status, Lymph-node status and size (NKI295). A positive (or red) value indicates a poorer prognosis, while a negative (or blue) value indicates a better prognosis. The associated hazard for ER-negative tumors is shown in model A for comparison. ↑=sub-signature enrichment, ↓=sub-signature repression, Ø=no significant signature enrichment and/or depletion. (E) Biological functions associated gene constituents of the sub-signatures (gene set enrichment p<0.05). See also Figure S6, S7 and Table S6-8.

Similar articles

Cited by

References

    1. Al-Hajj M, Wicha MS, Benito-Hernandez A, Morrison SJ, Clarke MF. Prospective identification of tumorigenic breast cancer cells. Proc Natl Acad Sci U S A. 2003;100:3983–3988. - PMC - PubMed
    1. Anbazhagan R, Osin PP, Bartkova J, Nathan B, Lane EB, Gusterson BA. The development of epithelial phenotypes in the human fetal and infant breast. J Pathol. 1998;184:197–206. - PubMed
    1. Ben-Porath I, Thomson MW, Carey VJ, Ge R, Bell GW, Regev A, Weinberg RA. An embryonic stem cell-like gene expression signature in poorly differentiated aggressive human tumors. Nat Genet. 2008;40:499–507. - PMC - PubMed
    1. Bonnefoix T, Bonnefoix P, Verdiel P, Sotto JJ. Fitting limiting dilution experiments with generalized linear models results in a test of the single-hit Poisson assumption. J Immunol Methods. 1996;194:113–119. - PubMed
    1. Brewer BG, Mitchell RA, Harandi A, Eaton JW. Embryonic vaccines against cancer: an early history. Exp Mol Pathol. 2009;86:192–197. - PubMed

Publication types

MeSH terms

Substances

Associated data