. 2012 Feb 3;148(3):608-19.
doi: 10.1016/j.cell.2011.12.025.

Optimality in the development of intestinal crypts

Affiliations

Optimality in the development of intestinal crypts

Shalev Itzkovitz et al. Cell. .

Abstract

Intestinal crypts in mammals are comprised of long-lived stem cells and shorter-lived progenies. These two populations are maintained in specific proportions during adult life. Here, we investigate the design principles governing the dynamics of these proportions during crypt morphogenesis. Using optimal control theory, we show that a proliferation strategy known as a "bang-bang" control minimizes the time to obtain a mature crypt. This strategy consists of a surge of symmetric stem cell divisions, establishing the entire stem cell pool first, followed by a sharp transition to strictly asymmetric stem cell divisions, producing nonstem cells with a delay. We validate these predictions using lineage tracing and single-molecule fluorescence in situ hybridization of intestinal crypts in infant mice, uncovering small crypts that are entirely composed of Lgr5-labeled stem cells, which become a minority as crypts continue to grow. Our approach can be used to uncover similar design principles in other developmental systems.


Figures

Figure 1
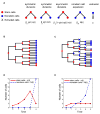
Figure 1. Stem Cell Division Strategies Determine Dynamic Crypt Composition
Hypothetical lineage trees (A–C) and resulting cell type dynamics (D–F) for purely asymmetric stem cell division (A and D), mixed symmetric and asymmetric divisions (B and E) and symmetric divisions transitioning to asymmetric divisions (C and F). Stem cells are red, nonstem cells are blue and extruded cells are marked with X.
Figure 2
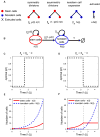
Figure 2. Bang-Bang Control Solution for Minimizing the Time to Attain a Mature Crypt
(A) Rates of change in the numbers of stem cells, n(t) and nonstem cells, N(t) as a function of the proliferation rates βn, βN, the extrusion rate α, and the probability that a stem cell divides symmetrically into two stem cells, p(t). (B) State diagram describing the dynamics of developing crypts. (C) The optimal strategy when the yield of nonstem cells per asymmetrically dividing stem cell is lower than that from a nonstem cell (βn < βN − α) entails initial asymmetric stem cell divisions of all stem cells followed by a transition to symmetric divisions. This optimal control gives rise to an early increase in nonstem cells and a delayed production of additional stem cells (E). (D) The optimal strategy when the yield of nonstem cell per asymmetrically dividing stem cell is higher than that from a nonstem cell (βn > βN − α) entails initial symmetric divisions of all stem cells followed by a transition to asymmetric divisions. This optimal control gives rise to an initial expansion of the entire stem cell pool and a delayed production of nonstem cells (F). (E and F) show the resulting dynamics of stem cell and nonstem cell numbers for the optimal solutions of (C,D) respectively. Parameters used are n0 = 1, N0 = 0, nT = 10, NT = 50, βN − α = 1.1 × βn (C,E) βN − α = 0.7 × βn (D,F). See also Figure S1.
Figure 3
Figure 3. A Mature Crypt Can Be Achieved More Rapidly if Stem Cell Numbers Are Allowed to Overshoot
(A) Stem cell dynamics in a model that includes both symmetric divisions into two stem cells (with probability p(t)) and symmetric divisions into two nonstem cells (with probability q(t)). (B–E) Example of a mature crypt, containing two stem cells and 14 nonstem cells, which can be obtained in a shorter time if stem cell numbers are allowed to overshoot their adult numbers. (B) Optimal lineage tree in which stem cells (red) first expand for three generations through symmetric divisions. In the fourth and final generation seven of the eight stem cells symmetrically divide into two nonstem cells (blue) and the remaining stem cell symmetrically divides into two stem cells, yielding the mature crypt in four generations. The resulting population dynamics are shown in (D). (C and E) The optimal solution if stem cell numbers are not allowed to overshoot (q(t) ≤ p(t)) includes one generation in which a symmetric stem cell division generates the adult pool of two stem cells followed by a switch to asymmetric divisions generating the nonstem cells. Because nonstem cells exist longer than in (B) and (D) their overall extrusion is higher and the total time to a mature crypt in (C) and (E) exceeds that for the solution in (B) and (D). Note that the population dynamics in (E) will remain unchanged if in the second phase equal fractions of stem cells will symmetrically divide into either two stem cells or two nonstem cells (p = q), rather than having all dividing strictly asymmetrically. Nonstem cells are extruded with rate α = 0.3.
Figure 4
Figure 4. Lgr5 Marks Stem Cells in Developing Crypts
(A) Progenies of Lgr5 cells extend from the crypts through the villi. Duodenum from 5-day-old Lgr5-EGFP-IRES-CreERT2/Rosa26LSL-lacZ mouse injected with tamoxifen and sacrificed after 4 weeks. Blue cells are progenies of Lgr5 cells that express the lacZ reporter gene. (B) Distributions of crypt sizes in 5-day-old mice (blue) and adult mice (red). Crypt size is the number of cells along an outline in a crypt longitudinal cross-section. Small intestine of 5-day-old mice contains crypts of variable sizes spanning the entire developmental process. (C) H&E staining of duodenum from a 5-day-old mouse. Arrows mark crypts of variable sizes budding from the intervillus pockets. (D) Duodenum from an adult mouse shows larger and more uniform sized crypts. Scale bars represent 20 μm (C and D). See also Figure S2.
Figure 5
Figure 5. Lgr5+ Stem Cells and Lgr5− Cells Divide at the Fastest Possible Rate during Crypt Morphogenesis
(A) Combined detection of single Lgr5 mRNA (green dots) and EdU (red nuclei) in a small intestinal crypt from a 6-day-old mouse. Blue is DAPI nuclear staining and the dashed lines are cell borders. Scale bar represents 10 μm. (B) The estimated cell cycle period in 6-day-old epithelial cells is about 15 hr for both Lgr5+ and Lgr5− cells in developing crypts. In adult crypts Lgr5+ cells proliferate more slowly (cell cycle time of 23 hr) whereas the Lgr5− cells divide once every 15 hr. Quantification was done only on cells that were positive for Ki67, detected using single-molecule FISH. Error bars represent standard errors of the mean across different crypts.
Figure 6
Figure 6. Stem Cell Dynamics in Developing Crypts Fit the Bang-Bang Control Solution
(A) Single-molecule FISH of Lgr5 in small intestinal frozen sections of 5-day-old mice and adult mice. Green dots are single Lgr5 transcripts, dashed lines denote the crypt cells. Blue is DAPI nuclear staining and the dashed red line denotes the crypt-villus border. Scale bar represents 10 μm. Cell segmentation was based on the DAPI image and simultaneous immunofluorescence with FITC labeled E-cadherin antibody (Figure S2C). (B) Crypt dynamics displays a temporal order. Small crypts are exclusively composed of Lgr5 stem cells. When the crypt reaches a size equal to the number of Lgr5 stem cells in the adult crypt (10 cells per crypt longitudinal section, gray vertical dashed line) a transition to nonstem cell production occurs. Goblet cells (black diamonds) and Paneth cells (green triangles) appear at later developmental stages. Dashed red and blue curves are the dynamics predicted from the optimal control solution. (C) Fraction of stem cells as a function of crypt size fits the bang-bang control solution (gray curve). Also shown are the expected dynamics under purely asymmetric stem cell divisions (cyan dashed curve) and constant fraction of stem cells and nonstem cells (red dashed line). Symbols and error bars in (B) and (C) are means and standard errors, respectively, of values in a moving window of five cells. This analysis was based on 248 crypts. See also Figure S4.
Figure 7
Figure 7. Asymmetric Phase during Crypt Morphogenesis Entails Asymmetric Divisions of Individual Stem Cells
(A) Example of a small crypt with a pair of Lgr5+ cells expressing the tdTomato reporter, representing the progenies of a symmetric division. (B) Example of a larger crypt with a mixed pair in which one progeny is an Lgr5+ cell and the second progeny is Lgr5−. White arrows in (A) and (B) mark labeled cells. Scale bar represents 10 μm. (C) Analysis of the Lgr5 status of labeled pairs of cells (with tdTomato fluorescence) in crypts with exactly two labeled cells. Small crypts (less than 12 cells per crypt outline) exhibit mostly pairs of cells that are both Lgr5+. Larger crypts contain mixed pairs, in which one progeny is Lgr5+ and the second is Lgr5−. No pair of labeled cells both lacking Lgr5 expression was found. Error bars represent standard error of the mean over two mice.

Similar articles

Cited by

References

    1. Al-Nafussi AI, Wright NA. Cell kinetics in the mouse small intestine during immediate postnatal life. Virchows Arch B Cell Pathol Incl Mol Pathol. 1982;40:51–62. - PubMed
    1. Alon U. An Introduction to Systems Biology: Design Principles of Biological Circuits. Chapman and Hall/CRC; 2006.
    1. Barker N, van Es JH, Kuipers J, Kujala P, van den Born M, Cozijnsen M, Haegebarth A, Korving J, Begthel H, Peters PJ, Clevers H. Identification of stem cells in small intestine and colon by marker gene Lgr5. Nature. 2007;449:1003–1007. - PubMed
    1. Bjerknes M, Cheng H. The stem-cell zone of the small intestinal epithelium. II. Evidence from Paneth cells in the newborn mouse. Am J Anat. 1981;160:65–75. - PubMed
    1. Blanpain C, Fuchs E. Epidermal stem cells of the skin. Annu Rev Cell Dev Biol. 2006;22:339–373. - PMC - PubMed

Publication types

Substances