Inflammasome-mediated dysbiosis regulates progression of NAFLD and obesity
- PMID: 22297845
- PMCID: PMC3276682
- DOI: 10.1038/nature10809
Inflammasome-mediated dysbiosis regulates progression of NAFLD and obesity
Abstract
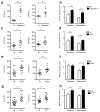
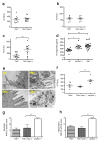
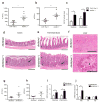
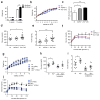
Non-alcoholic fatty liver disease (NAFLD) is the hepatic manifestation of metabolic syndrome and the leading cause of chronic liver disease in the Western world. Twenty per cent of NAFLD individuals develop chronic hepatic inflammation (non-alcoholic steatohepatitis, NASH) associated with cirrhosis, portal hypertension and hepatocellular carcinoma, yet the causes of progression from NAFLD to NASH remain obscure. Here, we show that the NLRP6 and NLRP3 inflammasomes and the effector protein IL-18 negatively regulate NAFLD/NASH progression, as well as multiple aspects of metabolic syndrome via modulation of the gut microbiota. Different mouse models reveal that inflammasome-deficiency-associated changes in the configuration of the gut microbiota are associated with exacerbated hepatic steatosis and inflammation through influx of TLR4 and TLR9 agonists into the portal circulation, leading to enhanced hepatic tumour-necrosis factor (TNF)-α expression that drives NASH progression. Furthermore, co-housing of inflammasome-deficient mice with wild-type mice results in exacerbation of hepatic steatosis and obesity. Thus, altered interactions between the gut microbiota and the host, produced by defective NLRP3 and NLRP6 inflammasome sensing, may govern the rate of progression of multiple metabolic syndrome-associated abnormalities, highlighting the central role of the microbiota in the pathogenesis of heretofore seemingly unrelated systemic auto-inflammatory and metabolic disorders.
Conflict of interest statement
The authors report no conflict of interest.
Figures


Comment in
-
Gut microbiota influences liver disease.Nat Rev Immunol. 2012 Feb 17;12(3):153. doi: 10.1038/nri3177. Nat Rev Immunol. 2012. PMID: 22343570 No abstract available.
-
Microbiota: Dysbiosis driven by inflammasome deficiency exacerbates hepatic steatosis and governs rate of NAFLD progression.Nat Rev Gastroenterol Hepatol. 2012 Feb 21;9(3):123. doi: 10.1038/nrgastro.2012.21. Nat Rev Gastroenterol Hepatol. 2012. PMID: 22349167 No abstract available.
-
Is predisposition to NAFLD and obesity communicable?Cell Metab. 2012 Apr 4;15(4):419-20. doi: 10.1016/j.cmet.2012.03.013. Cell Metab. 2012. PMID: 22482724
-
Transmissible fatty liver disease.Am J Transplant. 2012 May;12(5):1071. doi: 10.1111/j.1600-6143.2012.04095.x. Am J Transplant. 2012. PMID: 22537259 No abstract available.
-
Liver repercussions of defective gut surveillance.Hepatology. 2012 Sep;56(3):1174-7. doi: 10.1002/hep.25944. Hepatology. 2012. PMID: 22930647 No abstract available.
Similar articles
-
Inhibition of NLRP3 inflammasome by thioredoxin-interacting protein in mouse Kupffer cells as a regulatory mechanism for non-alcoholic fatty liver disease development.Oncotarget. 2017 Jun 6;8(23):37657-37672. doi: 10.18632/oncotarget.17489. Oncotarget. 2017. PMID: 28499273 Free PMC article.
-
Both bone marrow-derived and non-bone marrow-derived cells contribute to AIM2 and NLRP3 inflammasome activation in a MyD88-dependent manner in dietary steatohepatitis.Liver Int. 2014 Oct;34(9):1402-13. doi: 10.1111/liv.12537. Epub 2014 Apr 17. Liver Int. 2014. PMID: 24650018 Free PMC article.
-
Cardiolipin inhibitor ameliorates the non-alcoholic steatohepatitis through suppressing NLRP3 inflammasome activation.Eur Rev Med Pharmacol Sci. 2019 Sep;23(18):8158-8167. doi: 10.26355/eurrev_201909_19036. Eur Rev Med Pharmacol Sci. 2019. PMID: 31599445
-
Role of NLRP3 Inflammasome in the Progression of NAFLD to NASH.Can J Gastroenterol Hepatol. 2016;2016:6489012. doi: 10.1155/2016/6489012. Epub 2016 May 4. Can J Gastroenterol Hepatol. 2016. PMID: 27446858 Free PMC article. Review.
-
NLRP3 inflammasome in hepatic diseases: A pharmacological target.Biochem Pharmacol. 2023 Nov;217:115861. doi: 10.1016/j.bcp.2023.115861. Epub 2023 Oct 18. Biochem Pharmacol. 2023. PMID: 37863329 Review.
Cited by
-
Acute and chronic plasma metabolomic and liver transcriptomic stress effects in a mouse model with features of post-traumatic stress disorder.PLoS One. 2015 Jan 28;10(1):e0117092. doi: 10.1371/journal.pone.0117092. eCollection 2015. PLoS One. 2015. PMID: 25629821 Free PMC article.
-
Pathways in microbe-induced obesity.Cell Metab. 2013 Jun 4;17(6):883-894. doi: 10.1016/j.cmet.2013.05.004. Cell Metab. 2013. PMID: 23747247 Free PMC article. Review.
-
Lactobacillus fermentum promotes adipose tissue oxidative phosphorylation to protect against diet-induced obesity.Exp Mol Med. 2020 Sep;52(9):1574-1586. doi: 10.1038/s12276-020-00502-w. Epub 2020 Sep 11. Exp Mol Med. 2020. PMID: 32917958 Free PMC article.
-
The role of gut-liver axis in the pathogenesis of liver cirrhosis and portal hypertension.Clin Mol Hepatol. 2012 Dec;18(4):337-46. doi: 10.3350/cmh.2012.18.4.337. Epub 2012 Dec 21. Clin Mol Hepatol. 2012. PMID: 23323248 Free PMC article. Review.
-
Regulation of intestinal microbiota by the NLR protein family.Int Immunol. 2013 Apr;25(4):207-14. doi: 10.1093/intimm/dxs116. Epub 2013 Jan 15. Int Immunol. 2013. PMID: 23325116 Free PMC article. Review.
References
-
- Sheth SG, Gordon FD, Chopra S. Nonalcoholic steatohepatitis. Ann Intern Med. 1997;126:137–145. - PubMed
-
- Ludwig J, Viggiano TR, McGill DB, Oh BJ. Nonalcoholic steatohepatitis: Mayo Clinic experiences with a hitherto unnamed disease. Mayo Clin Proc. 1980;55:434–438. - PubMed
-
- Marchesini G, et al. Nonalcoholic fatty liver, steatohepatitis, and the metabolic syndrome. Hepatology. 2003;37:917–923. - PubMed
-
- Caldwell SH, et al. Cryptogenic cirrhosis: clinical characterization and risk factors for underlying disease. Hepatology. 1999;29:664–669. - PubMed
-
- Shimada M, et al. Hepatocellular carcinoma in patients with non-alcoholic steatohepatitis. J Hepatol. 2002;37:154–160. - PubMed
Publication types
MeSH terms
Substances
Grants and funding
- R24 DK-085638/DK/NIDDK NIH HHS/United States
- HHMI/Howard Hughes Medical Institute/United States
- U24 DK059635/DK/NIDDK NIH HHS/United States
- P30 DK-45735/DK/NIDDK NIH HHS/United States
- U24 DK-059635/DK/NIDDK NIH HHS/United States
- P30 DK045735-14/DK/NIDDK NIH HHS/United States
- T32 HL007974/HL/NHLBI NIH HHS/United States
- R01 DK-40936/DK/NIDDK NIH HHS/United States
- R01 DK076674/DK/NIDDK NIH HHS/United States
- R01 DK040936/DK/NIDDK NIH HHS/United States
- K08A1085038/PHS HHS/United States
- R01DK076674-01/DK/NIDDK NIH HHS/United States
- R24 DK085638/DK/NIDDK NIH HHS/United States
- P30 DK045735/DK/NIDDK NIH HHS/United States
- T32HL007974/HL/NHLBI NIH HHS/United States
LinkOut - more resources
Full Text Sources
Other Literature Sources
Medical
Molecular Biology Databases
Miscellaneous

