MicroRNA miR-150 is involved in Vα14 invariant NKT cell development and function
- PMID: 22287707
- PMCID: PMC7375412
- DOI: 10.4049/jimmunol.1103342
MicroRNA miR-150 is involved in Vα14 invariant NKT cell development and function
Abstract
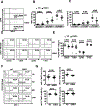
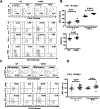
CD1d-restricted Vα14 invariant NKT (iNKT) cells play an important role in the regulation of diverse immune responses. MicroRNA-mediated RNA interference is emerging as a crucial regulatory mechanism in the control of iNKT cell differentiation and function. Yet, roles of specific microRNAs in the development and function of iNKT cells remain to be further addressed. In this study, we identified the gradually increased expression of microRNA-150 (miR-150) during the maturation of iNKT cells in thymus. Using miR-150 knockout (KO) mice, we found that miR-150 deletion resulted in an interruption of iNKT cell final maturation in both thymus and periphery. Upon activation, iNKT cells from miR-150KO mice showed significantly increased IFN-γ production compared with wild-type iNKT cells. Bone marrow-transferring experiments demonstrated the cell-intrinsic characteristics of iNKT cell maturation and functional defects in mice lacking miR-150. Furthermore, miR-150 target c-Myb was significantly upregulated in miR-150KO iNKT cells, which potentially contribute to iNKT cell defects in miR-150KO mice. Our data define a specific role of miR-150 in the development and function of iNKT cells.
Conflict of interest statement
Disclosures
The authors have no financial conflicts of interest
Figures


Similar articles
-
Invariant NKT cell development and function in microRNA-223 knockout mice.Int Immunopharmacol. 2011 May;11(5):561-8. doi: 10.1016/j.intimp.2010.11.004. Epub 2010 Nov 19. Int Immunopharmacol. 2011. PMID: 21094288
-
Critical role for invariant chain in CD1d-mediated selection and maturation of Vα14-invariant NKT cells.Immunol Lett. 2011 Sep 30;139(1-2):33-41. doi: 10.1016/j.imlet.2011.04.012. Epub 2011 May 5. Immunol Lett. 2011. PMID: 21565221 Free PMC article.
-
Invariant natural killer T-cell development and function with loss of microRNA-155.Immunology. 2018 Feb;153(2):238-245. doi: 10.1111/imm.12836. Epub 2017 Oct 5. Immunology. 2018. PMID: 28892129 Free PMC article.
-
New Genetically Manipulated Mice Provide Insights Into the Development and Physiological Functions of Invariant Natural Killer T Cells.Front Immunol. 2018 Jun 14;9:1294. doi: 10.3389/fimmu.2018.01294. eCollection 2018. Front Immunol. 2018. PMID: 29963043 Free PMC article. Review.
-
T Cell Receptor Expression Timing and Signal Strength in the Functional Differentiation of Invariant Natural Killer T Cells.Front Immunol. 2019 Apr 26;10:841. doi: 10.3389/fimmu.2019.00841. eCollection 2019. Front Immunol. 2019. PMID: 31080448 Free PMC article. Review.
Cited by
-
Short-term memory of danger signals and environmental stimuli in immune cells.Nat Immunol. 2013 Aug;14(8):777-84. doi: 10.1038/ni.2636. Nat Immunol. 2013. PMID: 23867934
-
AKT Isoforms in the Immune Response in Cancer.Curr Top Microbiol Immunol. 2022;436:349-366. doi: 10.1007/978-3-031-06566-8_15. Curr Top Microbiol Immunol. 2022. PMID: 36243852
-
Development of Unconventional T Cells Controlled by MicroRNA.Front Immunol. 2019 Oct 23;10:2520. doi: 10.3389/fimmu.2019.02520. eCollection 2019. Front Immunol. 2019. PMID: 31708931 Free PMC article. Review.
-
High Frequency of Gamma Interferon-Producing PLZFloRORγtlo Invariant Natural Killer 1 Cells Infiltrating Herpes Simplex Virus 1-Infected Corneas Is Associated with Asymptomatic Ocular Herpesvirus Infection.J Virol. 2020 Apr 16;94(9):e00140-20. doi: 10.1128/JVI.00140-20. Print 2020 Apr 16. J Virol. 2020. PMID: 32102882 Free PMC article.
-
Mechanistic target of rapamycin complex 1 is critical for invariant natural killer T-cell development and effector function.Proc Natl Acad Sci U S A. 2014 Feb 25;111(8):E776-83. doi: 10.1073/pnas.1315435111. Epub 2014 Feb 10. Proc Natl Acad Sci U S A. 2014. PMID: 24516149 Free PMC article.
References
-
- Bendelac A, Savage PB, and Teyton L 2007. The biology of NKT cells. Annu Rev Immunol 25:297–336. - PubMed
-
- Bendelac A, Rivera MN, Park SH, and Roark JH 1997. Mouse CD1-specific NK1 T cells: development, specificity, and function. Annu Rev Immunol 15:535–562. - PubMed
-
- Ho EL, Carayannopoulos LN, Poursine-Laurent J, Kinder J, Plougastel B, Smith HR, and Yokoyama WM 2002. Costimulation of multiple NK cell activation receptors by NKG2D. J Immunol 169:3667–3675. - PubMed
-
- Egawa T, Eberl G, Taniuchi I, Benlagha K, Geissmann F, Hennighausen L, Bendelac A, and Littman DR 2005. Genetic evidence supporting selection of the Valpha14i NKT cell lineage from double-positive thymocyte precursors. Immunity 22:705–716. - PubMed
Publication types
MeSH terms
Substances
Grants and funding
LinkOut - more resources
Full Text Sources
Other Literature Sources
Molecular Biology Databases
Research Materials

