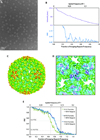
Direct electron detection yields cryo-EM reconstructions at resolutions beyond 3/4 Nyquist frequency
- PMID: 22285189
- PMCID: PMC3314222
- DOI: 10.1016/j.jsb.2012.01.008
Direct electron detection yields cryo-EM reconstructions at resolutions beyond 3/4 Nyquist frequency
Abstract
One limitation in electron cryo-microscopy (cryo-EM) is the inability to recover high-resolution signal from the image-recording media at the full-resolution limit of the transmission electron microscope. Direct electron detection using CMOS-based sensors for digitally recording images has the potential to alleviate this shortcoming. Here, we report a practical performance evaluation of a Direct Detection Device (DDD®) for biological cryo-EM at two different microscope voltages: 200 and 300 kV. Our DDD images of amorphous and graphitized carbon show strong per-pixel contrast with image resolution near the theoretical sampling limit of the data. Single-particle reconstructions of two frozen-hydrated bacteriophages, P22 and ε15, establish that the DDD is capable of recording usable signal for 3D reconstructions at about 4/5 of the Nyquist frequency, which is a vast improvement over the performance of conventional imaging media. We anticipate the unparalleled performance of this digital recording device will dramatically benefit cryo-EM for routine tomographic and single-particle structural determination of biological specimens.
Copyright © 2012 Elsevier Inc. All rights reserved.
Figures


Similar articles
-
Practical performance evaluation of a 10k × 10k CCD for electron cryo-microscopy.J Struct Biol. 2011 Sep;175(3):384-93. doi: 10.1016/j.jsb.2011.05.012. Epub 2011 May 17. J Struct Biol. 2011. PMID: 21619932 Free PMC article.
-
Observation of Bacteriophage Ultrastructure by Cryo-electron Microscopy.Methods Mol Biol. 2018;1693:43-55. doi: 10.1007/978-1-4939-7395-8_5. Methods Mol Biol. 2018. PMID: 29119431
-
[Progress in filters for denoising cryo-electron microscopy images].Beijing Da Xue Xue Bao Yi Xue Ban. 2021 Mar 3;53(2):425-433. doi: 10.19723/j.issn.1671-167X.2021.02.033. Beijing Da Xue Xue Bao Yi Xue Ban. 2021. PMID: 33879921 Free PMC article. Chinese.
-
Routine Collection of High-Resolution cryo-EM Datasets Using 200 KV Transmission Electron Microscope.J Vis Exp. 2022 Mar 16;(181). doi: 10.3791/63519. J Vis Exp. 2022. PMID: 35377368 Review.
-
Obtaining high-resolution images of biological macromolecules by using a cryo-electron microscope with a liquid-helium cooled stage.Micron. 2011 Feb;42(2):100-6. doi: 10.1016/j.micron.2010.08.006. Epub 2010 Sep 8. Micron. 2011. PMID: 20869255 Review.
Cited by
-
Three-dimensional reconstruction of icosahedral particles from single micrographs in real time at the microscope.J Struct Biol. 2013 Sep;183(3):329-341. doi: 10.1016/j.jsb.2013.07.007. Epub 2013 Jul 25. J Struct Biol. 2013. PMID: 23891839 Free PMC article.
-
A Molecular-Level Account of the Antigenic Hantaviral Surface.Cell Rep. 2016 May 3;15(5):959-967. doi: 10.1016/j.celrep.2016.03.082. Epub 2016 Apr 21. Cell Rep. 2016. PMID: 27117403 Free PMC article.
-
A feature-guided, focused 3D signal permutation method for subtomogram averaging.J Struct Biol. 2022 Jun;214(2):107851. doi: 10.1016/j.jsb.2022.107851. Epub 2022 Mar 26. J Struct Biol. 2022. PMID: 35346811 Free PMC article.
-
Montage electron tomography of vitrified specimens.J Struct Biol. 2022 Jun;214(2):107860. doi: 10.1016/j.jsb.2022.107860. Epub 2022 Apr 26. J Struct Biol. 2022. PMID: 35487464 Free PMC article.
-
Unified polymerization mechanism for the assembly of ASC-dependent inflammasomes.Cell. 2014 Mar 13;156(6):1193-1206. doi: 10.1016/j.cell.2014.02.008. Cell. 2014. PMID: 24630722 Free PMC article.
References
-
- Baker LA, Smith EA, Bueler SA, Rubinstein JL. The resolution dependence of optimal exposures in liquid nitrogen temperature electron cryomicroscopy of catalase crystals. J. Struct. Biol. 2010;169:431–437. - PubMed
-
- Booth CR, Jakana J, Chiu W. Assessing the capabilities of a 4k×4k CCD camera for electron cryo-microscopy. J. Struct. Biol. 2006;156:556–563. - PubMed
-
- Booth CR, Jiang W, Baker ML, Zhou ZH, Ludtke SJ, et al. A 9 Å single particle reconstruction from CCD captured images on a 200 kV electron cryo-microscope. J. Struct. Biol. 2004;147:116–127. - PubMed
Publication types
MeSH terms
Grants and funding
- P41 RR002250-26S1/RR/NCRR NIH HHS/United States
- P41RR002250/RR/NCRR NIH HHS/United States
- PN2EY016525/EY/NEI NIH HHS/United States
- P41 GM103832/GM/NIGMS NIH HHS/United States
- T32 GM008280/GM/NIGMS NIH HHS/United States
- P41 GM103832-27/GM/NIGMS NIH HHS/United States
- T15LM007093/LM/NLM NIH HHS/United States
- PN2 EY016525-08/EY/NEI NIH HHS/United States
- T15 LM007093-10S1/LM/NLM NIH HHS/United States
- P41 RR002250/RR/NCRR NIH HHS/United States
- T32 GM008280-22/GM/NIGMS NIH HHS/United States
- PN2 EY016525/EY/NEI NIH HHS/United States
- T15 LM007093/LM/NLM NIH HHS/United States
- PN2 EY016525-07/EY/NEI NIH HHS/United States
- T32 GM008280-23/GM/NIGMS NIH HHS/United States
- P41 RR002250-26/RR/NCRR NIH HHS/United States
LinkOut - more resources
Full Text Sources
Other Literature Sources
Research Materials

