. 2012 Jan 27;36(1):120-31.
doi: 10.1016/j.immuni.2011.11.018.

Autoimmunity initiates in nonhematopoietic cells and progresses via lymphocytes in an interferon-dependent autoimmune disease

Affiliations

Autoimmunity initiates in nonhematopoietic cells and progresses via lymphocytes in an interferon-dependent autoimmune disease

Alevtina Gall et al. Immunity. .

Abstract

The type I interferon (IFN) response initiated by detection of nucleic acids is important for antiviral defense but is also associated with specific autoimmune diseases. Mutations in the human 3' repair exonuclease 1 (Trex1) gene cause Aicardi-Goutières syndrome (AGS), an IFN-associated autoimmune disease. However, the source of the type I IFN response and the precise mechanisms of disease in AGS remain unknown. Here, we demonstrate that Trex1 is an essential negative regulator of the STING-dependent antiviral response. We used an in vivo reporter of IFN activity in Trex1-deficient mice to localize the initiation of disease to nonhematopoietic cells. These IFNs drove T cell-mediated inflammation and an autoantibody response that targeted abundant, tissue-restricted autoantigens. However, B cells contributed to mortality independently of T cell-mediated tissue damage. These findings reveal a stepwise progression of autoimmune disease in Trex1-deficient mice, with implications for the treatment of AGS and related disorders.


Figures

Figure 1
Figure 1. Trex1−/− mice develop specific multiorgan inflammation
(A) Representative hematoxylin and eosin-stained (H&E) tissue sections from Trex1 WT (T1 WT, top row) and Trex1−/− mice (bottom two rows). Skeletal muscle samples were taken from the masseter. Brain sections are from the cerebellum (top panels) and the neocortex (lower panel). Original magnifications: top 2 rows 10X; bottom row 20X except for neocortex, 10X. (B) Blinded analysis of indicated tissues from Trex1−/− (red) or WT (blue) mice. Data are represented as histological scores from individual animals and the mean (horizontal line) of experimental groups. Statistical analysis was performed using a two-tailed, unpaired Student’s t test. n.s. = not statistically significant (P > 0.05) *** = P ≤ 0.0005.
Figure 2
Figure 2. Trex1 is a specific negative regulator of STING-dependent signaling
(A) Survival curves of Trex1−/− mice, Mavs−/− mice, and Trex1−/−Mavs−/− mice. The Mavs−/− mice were generated on a pure C57Bl/6 background, so the plain Trex1−/− controls include mice generated from other contemporary crosses within this background. The Tmem173−/− mice were on a mixed C57Bl/6:129 background, and plain Trex1−/− mice generated from intercrossing Trex1+/−Tmem173+/+ mice are shown as controls. (B) Representative H&E-stained heart tissue sections from mice of the indicated genotypes. The original magnification in the top row is 10X and in the bottom two rows is 20X. (C) Blinded analysis of the indicated tissues of Trex1−/− mice crossed to Tmem173−/− and Mavs−/− mice. Plain Trex1−/− mice and controls are the same as in figure 1B and are presented for direct comparison to the other genotypes. For these and all other histological analyses presented below, statistical analysis was performed using a two-tailed, one-way ANOVA with Tukey’s multiple comparison post-test. * = p < 0.05, ** p ≤ 0.005, *** = P ≤ 0.0005.
Figure 3
Figure 3. Origins of the type I IFN response in Trex1-deficient mice
(A) Representative flow cytometry plots of YFP expression in peripheral blood of Trex1−/−Rag2+/− Rosa26-YFPR/WT Mx-Cre+ or Trex1−/−Rag2−/− Rosa26-YFPR/WT Mx-Cre+ and control mice of indicated ages. (B) Percentage of YFP+ cells from Trex1−/−Rag2+/− Rosa26-YFPR/WT Mx-Cre+ and control mice of indicated ages. Data are represented as means of percentages (n ≤ 7) and range. (C) Trex1−/− and control embryos of the indicated gestational age were analyzed by quantitative RT-PCR for expression of ISG15. Data are from 3–6 littermates per genotype and are presented as the ratio of ISG15 to HPRT. ***p ≤ 0.0005. (D) Longitudinal analysis of YFP expression in heart tissue sections from Trex1−/−Rag2+/− Rosa26-YFPR/WT Mx-Cre+ and control mice of the indicated ages. Sections were stained with anti-GFP rabbit polyclonal antibody followed by tyramide amplification (green fluorescence), and counterstained with DAPI (blue).
Figure 4
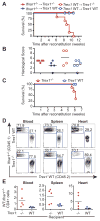
Figure 4. Non-hematopoietic cells initiate disease in Trex1-deficient mice
(A) Survival curves of female Trex1−/−Rag2−/− or Rag2−/− mice reconstituted with either Ifnar1−/− or WT bone marrow. Graph shows results from one out of two independent experiments, each with 5 mice per group. (B) Histological scores of hearts from Trex1−/− or WT female mice reconstituted with either Ifnar1−/− or WT bone marrow. (C) Percent survival of Trex1−/−Rag2−/− or Rag2−/− female mice (n=5 per group) reconstituted with a ~2:1 ratio of Ifnar1−/− (CD45.1):WT (CD45.2) bone marrow. Graph is representative of one out of two independent experiments. (D) Representative flow cytometry plots of CD45.1 (Ifnar1−/−) and CD45.2 (WT) expression by CD4+ cells in the indicated tissues of mixed bone marrow recipients. (E) The ratio of WT:Ifnar1−/− CD4 T cells was calculated for the indicated organs. We obtained identical results when examining CD8 T cells and B cells.
Figure 5
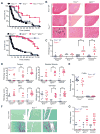
Figure 5. Contributions of αβ T cells and B cells to autoimmunity in Trex1−/− mice
(A) Survival curves for mice of indicated Trex1/Tcra (top panel) and Trex1/Ighm genotypes (bottom panel). Median lifespans of each Trex1−/− genotype are as follows. Trex1−/−: 10 weeks; Trex1−/−Tcra−/−: 56 weeks (p < 0.0001); Trex1−/−Ighm−/−: 73 weeks (p < 0.0001). Statistical analysis was performed using a Log-rank (Mantel-Cox) test. All mice were on a C57BL/6 background. (B) Representative H&E-stained sections of heart apex from mice of the indicated genotypes. (C) Blinded analysis of the endocardial region in Trex1−/− (red) or Trex1 WT (blue) mice of indicated Rag2, Tcra Ighm genotype, scored as in Figure 1B. *** = P ≤ 0.0005. (D) Blinded analysis of tissues from Trex1−/− (red) or Trex1 WT (blue) mice of indicated Tcra Ighm genotype. * = p < 0.05, ** p ≤ 0.005, *** = P ≤ 0.0005. (E) Colon sections from Trex1−/− (red) or Trex1 WT (blue) mice of indicated Tcra genotype were graded for inflammation, mucosal changes, dysplasia and extent of pathology. (F) Examples of picrosirius red/fast green-stained sections of left ventricle (endocardial region) to highlight collagen (fibrosis = red staining). (G) Endocardial and epicardial regions of the heart from Trex1−/− (red) or Trex1 WT (blue) mice of indicated Tcra Ighm genotype were graded for fibrosis. The average of the two scores was considered the total fibrosis score for each animal.
Figure 6
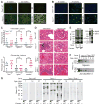
Figure 6. T cell-dependent autoantibody specificities in Trex1−/− mice
(A) Antinuclear antibodies in Trex1 WT (top panel) or Trex1−/− (bottom panel) sera from age-matched mice. Serum from a MRL-lpr/lpr mouse served as a positive control. (B) Kidney sections from Trex1 WT (top panel) or Trex1−/− (bottom panel) were stained with anti-mouse IgG (green) and DAPI (blue). (C) Interstitial kidney inflammation scores (top) and glomerulonephritis scores (bottom) for mice of the indicated genotypes. Each glomerular data point represents the average score of three individual glomeruli per animal. *** = P ≤ 0.0005. (D) Representative images of interstitial inflammation (left column) and individual glomeruli (right column) from mice of the indicated genotypes. Note that the cuboidal parietal epithelium of Bowman’s capsule is a normal finding in male mice. All images are shown at 600X magnification. (E) Silver stain of heart extract immunoprecipitations, using sera from WT or Trex1−/− mice. Immunoglobulin heavy chain (HC) and light chain (LC) are indicated. The right panel shows a Western blot (W) of heart extract blotted with Trex1−/− sera compared to the silver stain (S) of the proteins immunoprecipitated with the same sera. (F) Co-immunoprecipitation of heart extracts with sera from Trex1−/− or WT mice, immunoblotted with the indicated antibodies. (G) Heart extracts from Rag2−/− (neat and 1:5 diluted) and Trex1−/−Rag2−/− mice blotted with sera from Trex1 WT, Trex1−/− or Trex1−/−Tcra−/− mice of indicated ages, and detected with HRP-conjugated anti-mouse IgG.

Comment in

  • Tracking interferon in autoimmunity.
    Pascual V, Banchereau J. Pascual V, et al. Immunity. 2012 Jan 27;36(1):7-9. doi: 10.1016/j.immuni.2012.01.007. Immunity. 2012. PMID: 22284415 Free PMC article.

Similar articles

Cited by

References

    1. Ablasser A, Bauernfeind F, Hartmann G, Latz E, Fitzgerald KA, Hornung V. RIG-I-dependent sensing of poly(dA:dT) through the induction of an RNA polymerase III-transcribed RNA intermediate. Nat Immunol. 2009;10:1065–1072. - PMC - PubMed
    1. Banchereau J, Pascual V. Type I interferon in systemic lupus erythematosus and other autoimmune diseases. Immunity. 2006;25:383–392. - PubMed
    1. Barbalat R, Ewald SE, Mouchess ML, Barton GM. Nucleic acid recognition by the innate immune system. Annu Rev Immunol. 2011;29:185–214. - PubMed
    1. Barrat FJ, Meeker T, Gregorio J, Chan JH, Uematsu S, Akira S, Chang B, Duramad O, Coffman RL. Nucleic acids of mammalian origin can act as endogenous ligands for Toll-like receptors and may promote systemic lupus erythematosus. J Exp Med. 2005;202:1131–1139. - PMC - PubMed
    1. Barton GM, Kagan JC. A cell biological view of Toll-like receptor function: regulation through compartmentalization. Nat Rev Immunol. 2009;9:535–542. - PMC - PubMed

Publication types

MeSH terms

Supplementary concepts