

Quantitative analysis of multisite protein-ligand interactions by NMR: binding of intrinsically disordered p53 transactivation subdomains with the TAZ2 domain of CBP
- PMID: 22280219
- PMCID: PMC3290704
- DOI: 10.1021/ja209936u
Quantitative analysis of multisite protein-ligand interactions by NMR: binding of intrinsically disordered p53 transactivation subdomains with the TAZ2 domain of CBP
Abstract
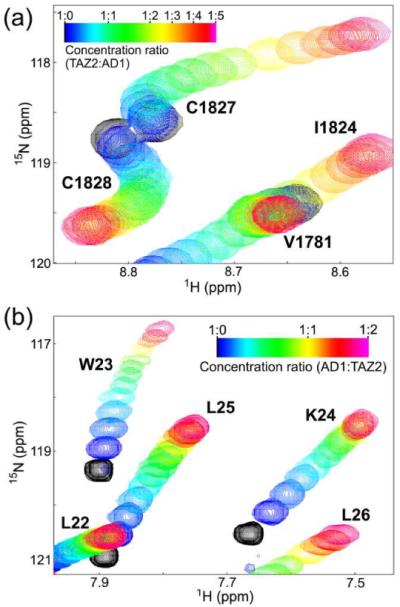
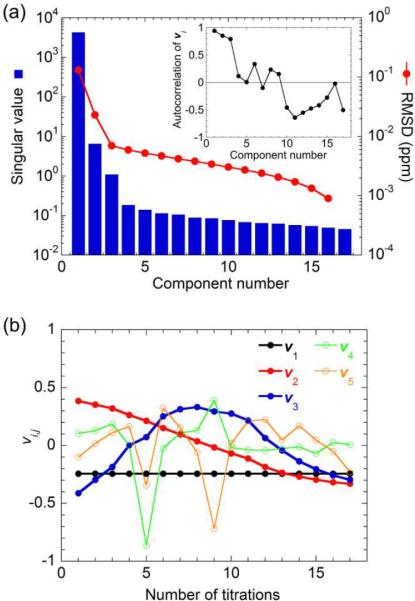
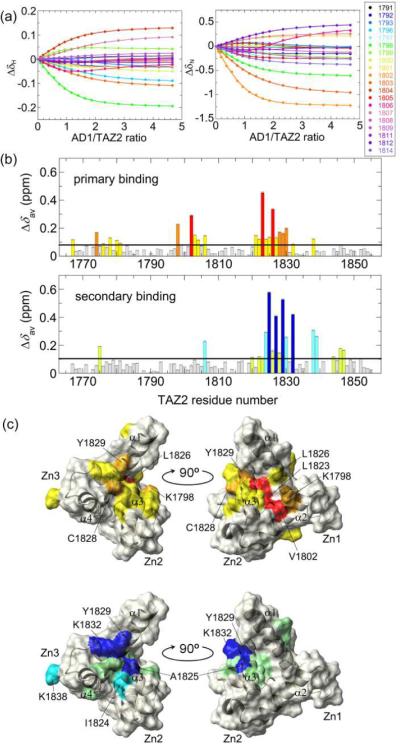
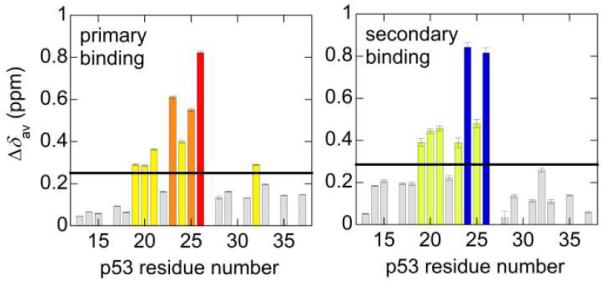
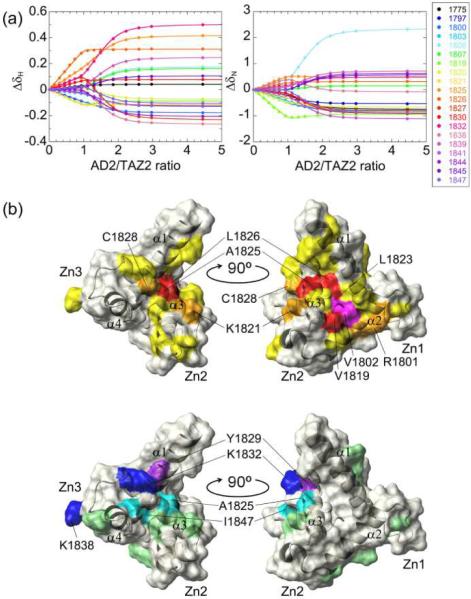
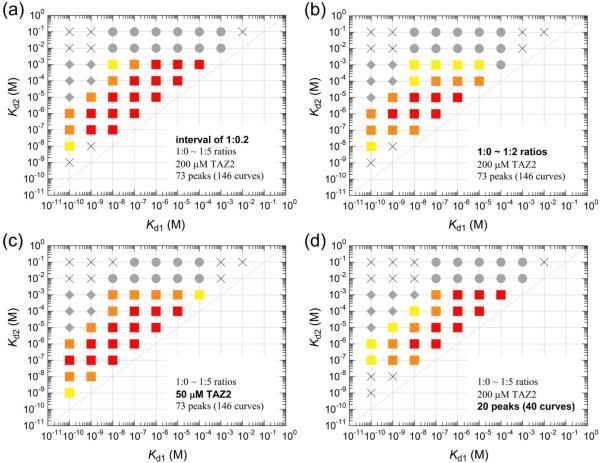
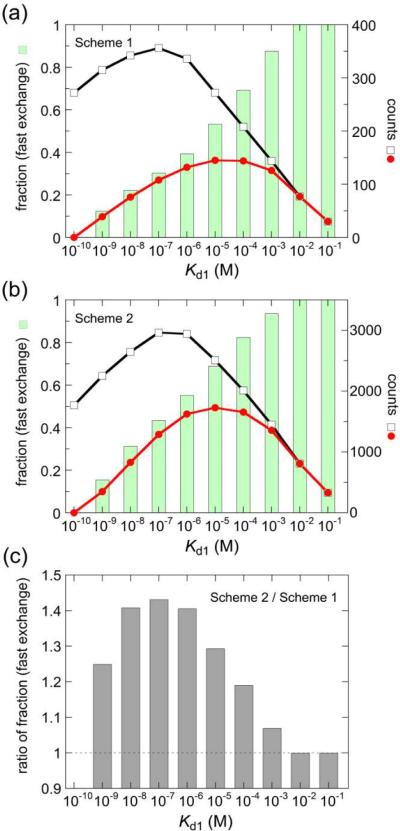
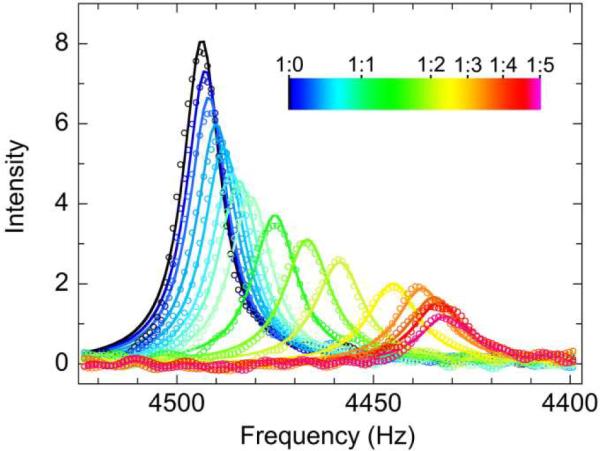
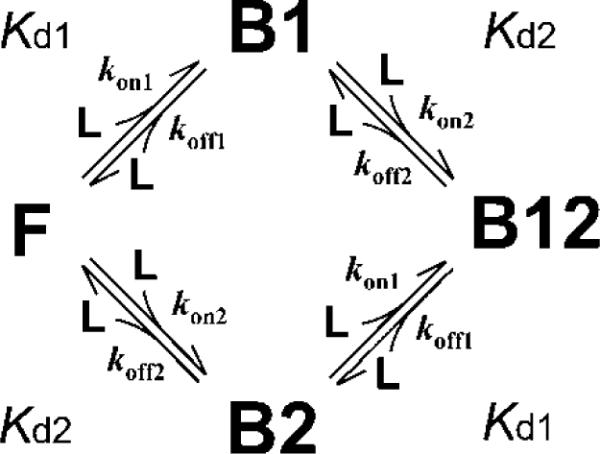
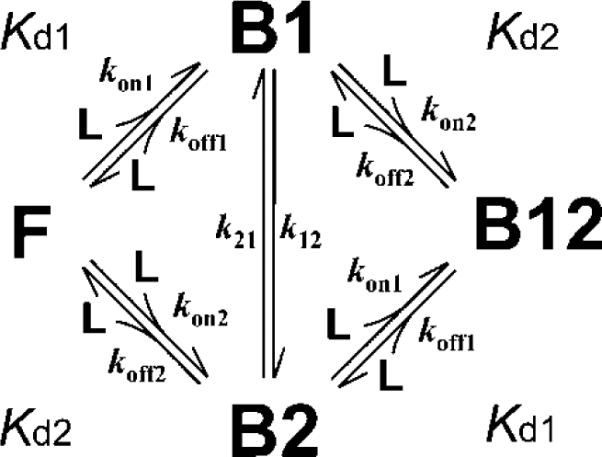
Determination of affinities and binding sites involved in protein-ligand interactions is essential for understanding molecular mechanisms in biological systems. Here we combine singular value decomposition and global analysis of NMR chemical shift perturbations caused by protein-protein interactions to determine the number and location of binding sites on the protein surface and to measure the binding affinities. Using this method we show that the isolated AD1 and AD2 binding motifs, derived from the intrinsically disordered N-terminal transactivation domain of the tumor suppressor p53, both interact with the TAZ2 domain of the transcriptional coactivator CBP at two binding sites. Simulations of titration curves and line shapes show that a primary dissociation constant as small as 1-10 nM can be accurately estimated by NMR titration methods, provided that the primary and secondary binding processes are coupled. Unexpectedly, the site of binding of AD2 on the hydrophobic surface of TAZ2 overlaps with the binding site for AD1, but AD2 binds TAZ2 more tightly. The results highlight the complexity of interactions between intrinsically disordered proteins and their targets. Furthermore, the association rate of AD2 to TAZ2 is estimated to be 1.7 × 10(10) M(-1) s(-1), approaching the diffusion-controlled limit and indicating that intrinsic disorder plus complementary electrostatics can significantly accelerate protein binding interactions.
© 2012 American Chemical Society
Figures
Similar articles
-
Mapping the interactions of the p53 transactivation domain with the KIX domain of CBP.Biochemistry. 2009 Mar 17;48(10):2115-24. doi: 10.1021/bi802055v. Biochemistry. 2009. PMID: 19220000 Free PMC article.
-
Recognition of the disordered p53 transactivation domain by the transcriptional adapter zinc finger domains of CREB-binding protein.Proc Natl Acad Sci U S A. 2016 Mar 29;113(13):E1853-62. doi: 10.1073/pnas.1602487113. Epub 2016 Mar 14. Proc Natl Acad Sci U S A. 2016. PMID: 26976603 Free PMC article.
-
Structural insights into TAZ2 domain-mediated CBP/p300 recruitment by transactivation domain 1 of the lymphopoietic transcription factor E2A.J Biol Chem. 2020 Mar 27;295(13):4303-4315. doi: 10.1074/jbc.RA119.011078. Epub 2020 Feb 25. J Biol Chem. 2020. PMID: 32098872 Free PMC article.
-
Cooperative regulation of p53 by modulation of ternary complex formation with CBP/p300 and HDM2.Proc Natl Acad Sci U S A. 2009 Apr 21;106(16):6591-6. doi: 10.1073/pnas.0811023106. Epub 2009 Apr 8. Proc Natl Acad Sci U S A. 2009. PMID: 19357310 Free PMC article.
-
Role of Intrinsic Protein Disorder in the Function and Interactions of the Transcriptional Coactivators CREB-binding Protein (CBP) and p300.J Biol Chem. 2016 Mar 25;291(13):6714-22. doi: 10.1074/jbc.R115.692020. Epub 2016 Feb 5. J Biol Chem. 2016. PMID: 26851278 Free PMC article. Review.
Cited by
-
Folding and binding of an intrinsically disordered protein: fast, but not 'diffusion-limited'.J Am Chem Soc. 2013 Jan 30;135(4):1415-22. doi: 10.1021/ja309527h. Epub 2013 Jan 22. J Am Chem Soc. 2013. PMID: 23301700 Free PMC article.
-
Characterization of the p300 Taz2-p53 TAD2 complex and comparison with the p300 Taz2-p53 TAD1 complex.Biochemistry. 2015 Mar 24;54(11):2001-10. doi: 10.1021/acs.biochem.5b00044. Epub 2015 Mar 16. Biochemistry. 2015. PMID: 25753752 Free PMC article.
-
Mapping the interactions of adenoviral E1A proteins with the p160 nuclear receptor coactivator binding domain of CBP.Protein Sci. 2016 Dec;25(12):2256-2267. doi: 10.1002/pro.3059. Epub 2016 Oct 15. Protein Sci. 2016. PMID: 27699893 Free PMC article.
-
The Fundamental Role of Flexibility on the Strength of Molecular Binding.Soft Matter. 2012;8(23):6385-6392. doi: 10.1039/C2SM25160D. Epub 2012 May 14. Soft Matter. 2012. PMID: 22707976 Free PMC article.
-
Ligand-induced structural transitions combined with paramagnetic ions facilitate unambiguous NMR assignments of methyl groups in large proteins.J Biomol NMR. 2022 Jun;76(3):59-74. doi: 10.1007/s10858-022-00394-0. Epub 2022 Apr 10. J Biomol NMR. 2022. PMID: 35397749 Free PMC article.
References
-
- Cavanagh J, Fairbrother WJ, Palmer AG, III, Rance M, Skelton NJ. Protein NMR Spectroscopy: Principles and Practice. Elsevier Academic Press; Burlington, MA: 2007.
-
- Fielding L. Prog. NMR Spectros. 2007;51:219.
-
- Henry ER, Hofrichter J. Methods Enzymol. 1992;210:129.
-
- Jaumot J, Vives M, Gargallo R. Anal. Biochem. 2004;327:1. - PubMed
-
- Beechem JM. Methods Enzymol. 1992;210:37. - PubMed
Publication types
MeSH terms
Substances
Grants and funding
LinkOut - more resources
Full Text Sources
Research Materials
Miscellaneous
