. 2012 Jun;11(6):O111.016717.
doi: 10.1074/mcp.O111.016717. Epub 2012 Jan 18.

Targeted data extraction of the MS/MS spectra generated by data-independent acquisition: a new concept for consistent and accurate proteome analysis

Affiliations

Targeted data extraction of the MS/MS spectra generated by data-independent acquisition: a new concept for consistent and accurate proteome analysis

Ludovic C Gillet et al. Mol Cell Proteomics. 2012 Jun.

Abstract

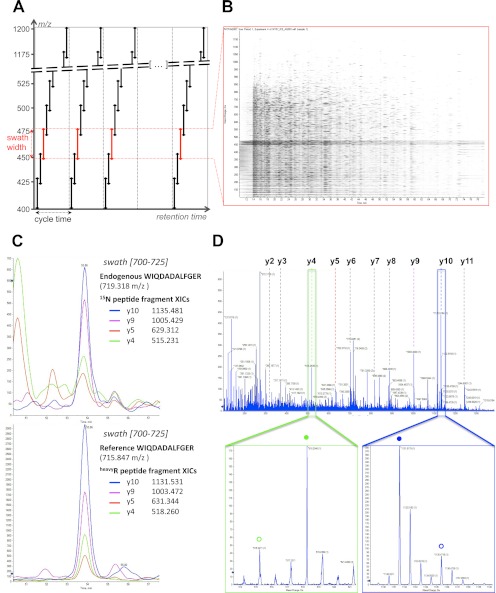
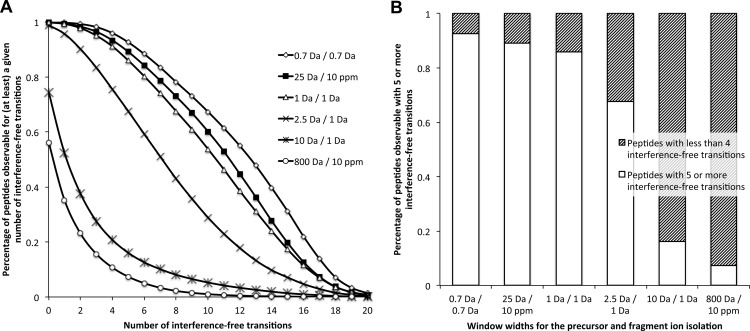
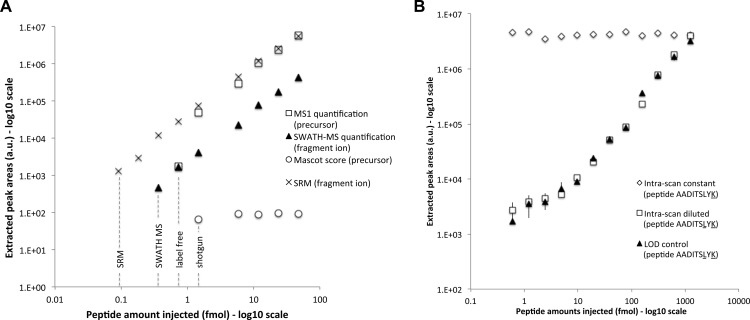
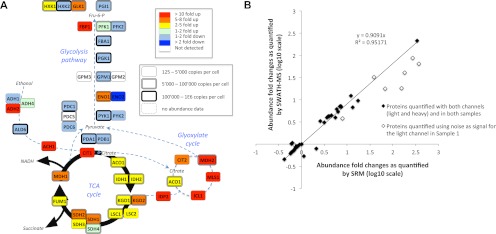
Most proteomic studies use liquid chromatography coupled to tandem mass spectrometry to identify and quantify the peptides generated by the proteolysis of a biological sample. However, with the current methods it remains challenging to rapidly, consistently, reproducibly, accurately, and sensitively detect and quantify large fractions of proteomes across multiple samples. Here we present a new strategy that systematically queries sample sets for the presence and quantity of essentially any protein of interest. It consists of using the information available in fragment ion spectral libraries to mine the complete fragment ion maps generated using a data-independent acquisition method. For this study, the data were acquired on a fast, high resolution quadrupole-quadrupole time-of-flight (TOF) instrument by repeatedly cycling through 32 consecutive 25-Da precursor isolation windows (swaths). This SWATH MS acquisition setup generates, in a single sample injection, time-resolved fragment ion spectra for all the analytes detectable within the 400-1200 m/z precursor range and the user-defined retention time window. We show that suitable combinations of fragment ions extracted from these data sets are sufficiently specific to confidently identify query peptides over a dynamic range of 4 orders of magnitude, even if the precursors of the queried peptides are not detectable in the survey scans. We also show that queried peptides are quantified with a consistency and accuracy comparable with that of selected reaction monitoring, the gold standard proteomic quantification method. Moreover, targeted data extraction enables ad libitum quantification refinement and dynamic extension of protein probing by iterative re-mining of the once-and-forever acquired data sets. This combination of unbiased, broad range precursor ion fragmentation and targeted data extraction alleviates most constraints of present proteomic methods and should be equally applicable to the comprehensive analysis of other classes of analytes, beyond proteomics.


Figures

Fig. 1.
Fig. 1.
SWATH MS data-independent acquisition and targeted data analysis. A, the data-independent acquisition method consists of the consecutive acquisition of high resolution, accurate mass fragment ion spectra during the entire chromatographic elution (retention time) range by repeatedly stepping through 32 discrete precursor isolation windows of 25-Da width (black double arrows) across the 400–1200 m/z range. The series of isolation windows acquired for a given precursor mass range and across the LC is referred to as a “swath” (e.g., series of the red double arrows). The cycle time is defined as the time required to return to the acquisition of the same precursor isolation window. Note that the dotted line before the beginning of each cycle depicts the optional acquisition of a high resolution, accurate mass survey (MS1) scan. B, representation of the actual data acquired in one swath (450–475 m/z range) shown here as an MS2 map, with retention time as the abscissa, fragment ion m/z as the ordinate, and ion intensity represented by color intensity. The darker horizontal band visible between 450 and 475 m/z corresponds to residual precursor ions for this swath. The signals co-eluting in the vertical direction are likely fragment ions originating from the same precursor ion. C, the targeted data analysis consists of retrieving the most intense fragment ions of a peptide of interest from a spectral library (list of fragment masses for the 15N-labeled peptide WIQDADALFGER or the corresponding C-terminal isotopically labeled reference) and extracting those fragment ion traces in the appropriate 700–725 swath using a narrow m/z window (e.g., 10 ppm). These fragment ion traces can be plotted as overlaid extracted ion chromatograms, similarly to SRM transitions. The peak group displaying the best co-eluting characteristics and matching best to the peak group of extracted reference fragment ion traces identifies and quantifies the target peptide. D, the complete high resolution, accurate mass fragment ion spectra underlying the best candidate peak group can be extracted from the raw data. These spectra can be inspected to confirm that the extracted signals originate from mass accurate monoisotopic fragment ion with the right charge state (e.g., lower panel zooms on the y4 (green box) and y10 (blue box) fragment, with the endogenous and reference peptide fragments annotated with open or closed circles, respectively). They can also be extensively annotated to strengthen the identification of the peptide (top panel).
Fig. 2.
Fig. 2.
Simulated fragment ion interferences for various LC-MS/MS acquisition scenarios. A, fragment ion interference cumulative plots are computed as described under “Materials and Methods” by taking into account fragments ions from doubly charged yeast tryptic peptide precursors against the fragment ions from the doubly and triply charged yeast tryptic peptides reported in PeptideAtlas (www.peptideatlas.org). The distribution of peptides with specific numbers of interference-free transitions are shown for the following simulations (precursor and fragment ion isolation respectively): 0.7 Da/0.7 Da (open diamonds), 25 Da/10 ppm (black squares), 1 Da/1 Da (open triangles), 2.5 Da/1 Da (crosses), 10 Da/1 Da (asterisks), and 800 Da/10 ppm (open circles). Simulation plots for other background or acquisition scenarios are available in supplemental Fig. S3. B, the fraction of peptides observable with five or more interference-free transitions for the various acquisition scenarios is presented in the histogram with white bars. Accordingly, the shaded bars represent the fraction of peptides having less than four interference-free transitions.
Fig. 3.
Fig. 3.
Limit of detection and intrascan dynamic range. A, the areas (y axis) of the precursor ion extracted from the survey scan (open squares) and of the most intense fragment ion extracted from the SWATH MS (closed triangles) and SRM (black crosses) quantifications are shown for the different serial dilution experiments (injected amounts of the peptide ELGQSGVDTYLQTK diluted in a yeast tryptic background in the x axis). The Mascot scores of the peptide identified in the same dilution series samples but acquired in DDA mode are shown as open circles. The limits of detection for the different methods are indicated with dotted lines. The complete series of LOD plots and corresponding lists of peak areas for the precursor and fragment ion traces quantified during these dilution series experiments are provided in supplemental Table 1 for the full set of 61 reference peptides. B, similar quantification plot for the doubly isotopically labeled peptide AADITSLYK serially diluted in a yeast tryptic background is shown here for the most intense fragment ion with closed triangles (“LOD control”). The intrascan dynamic range experiment consists of a dilution series of the same peptide AADITSLYK (open squares, “intrascan diluted”) in the presence of a constant amount of a singly isotopically labeled peptide AADITSLYK (open diamonds, “intrascan constant”), in the same yeast tryptic background. The complete lists of peak areas for the precursor and fragment ion traces quantified during the dilution series and intrascan dynamic range experiments are provided in supplemental Table 2. Screenshots of the quantified fragment ion traces and of the MS/MS spectra (zoomed around the y7 fragment) underlying the peptide peak apex are provided in supplemental Fig. S6 for the sample sets of the intrascan dynamic range experiment.
Fig. 4.
Fig. 4.
Quantification by SWATH MS of the abundance fold changes of 45 enzymes involved in the yeast central carbon metabolism during a diauxic shift experiment. A, schematic representation of the yeast central carbon metabolism network. The abundance fold changes of the enzymes quantified by SWATH MS (supplemental Tables 4–7) are coded with colors. The box shapes are indicative of the absolute abundances of the proteins determined for yeast in log phase growth (32). Those values constitute therefore an approximation of the absolute abundances of the enzymes at the beginning of the diauxic shift experiment, and based on which the fold changes are determined. B, correlation between the abundance fold changes of the same metabolic enzymes quantified by SRM (15) (abscissa) and SWATH MS (ordinate). The linear regression was calculated with the refined SWATH MS quantification values and without taking into account the fold changes for the proteins whose peptides presented light signal intensities below noise levels for the first time point of the diauxic shift (open diamonds), similar to the SRM study (15). Because the standard deviations for the SWATH MS and SRM quantifications are not directly comparable (see “Materials and Methods”), they are provided on separate plots in supplemental Table 5. The complete lists of peak areas for the quantified fragment ion traces and corresponding protein abundance fold changes are provided in supplemental Tables 4–7.
Fig. 5.
Fig. 5.
Extended quantification by SWATH MS of the abundance fold changes of mitochondrial enzymes during a diauxic shift experiment. Schematic representation of the respiratory chain and oxidative phosphorylation networks inspired by the Kyoto Encyclopedia of Genes and Genomes pathway representation (47). The abundance fold changes of the enzymes quantified by SWATH MS are coded with colors. The box shapes are indicative of the absolute abundances of the proteins with the same notices as those mentioned in Fig. 4. The complete list of peptides and of their fragment ions used to quantify those proteins, as well as the peak areas and corresponding protein abundance fold changes are provided in supplemental Table 7.
Fig. 6.
Fig. 6.
Application of SWATH MS targeted analysis to identify peptide modifications. The six most intense fragment ion traces for the 14N-labeled (light) and 15N-labeled (heavy) forms of the peptide MIEIMLPVFDAPQNLVEQAK, extracted from the swath 750–775, are shown for the yeast diauxic shift sample y8 (late time point). None of the classical SRM criteria (fragments co-elution, light-heavy peptide co-elution, relative intensities of the fragment ions) can discriminate the three candidate peak groups found here. By extracting additional, nonshared fragment ion traces, the identification of the peptide can be confirmed, and the site of the oxidized methionine modification can be unambiguously assigned onto the peptide sequence (supplemental Fig. S10).

Similar articles

Cited by

References

    1. Aebersold R., Mann M. (2003) Mass spectrometry-based proteomics. Nature 422, 198–207 - PubMed
    1. MacCoss M. J., Matthews D. L. (2005) Teaching a new dog old tricks. Anal. Chem. 77, 295A–302A - PubMed
    1. Han X., Aslanian A., Yates J. R., 3rd (2008) Mass spectrometry for proteomics. Curr. Opin. Chem. Biol. 12, 483–490 - PMC - PubMed
    1. Walther T. C., Mann M. (2010) Mass spectrometry-based proteomics in cell biology. J. Cell Biol. 190, 491–500 - PMC - PubMed
    1. Domon B., Aebersold R. (2006) Mass spectrometry and protein analysis. Science 312, 212–217 - PubMed

Publication types

MeSH terms