

Multidimensional characterization and differentiation of neurons in the anteroventral cochlear nucleus
- PMID: 22253838
- PMCID: PMC3253815
- DOI: 10.1371/journal.pone.0029965
Multidimensional characterization and differentiation of neurons in the anteroventral cochlear nucleus
Abstract
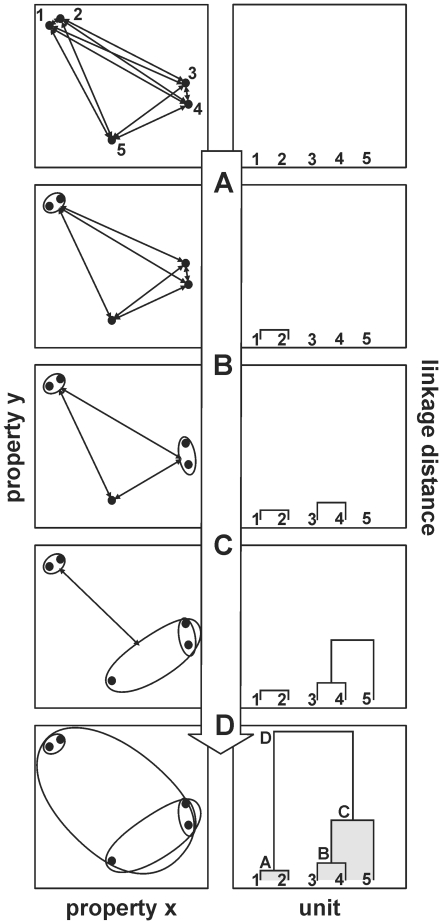
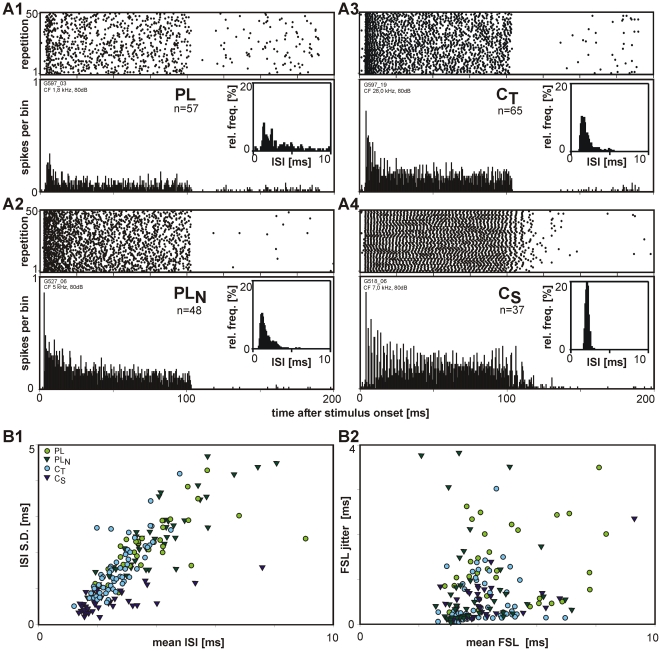
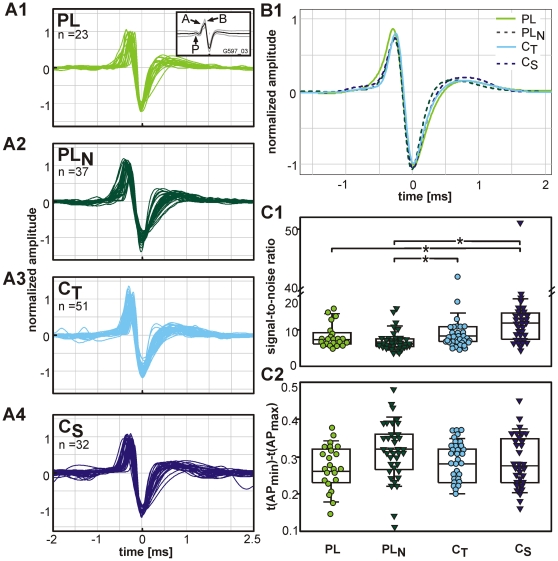
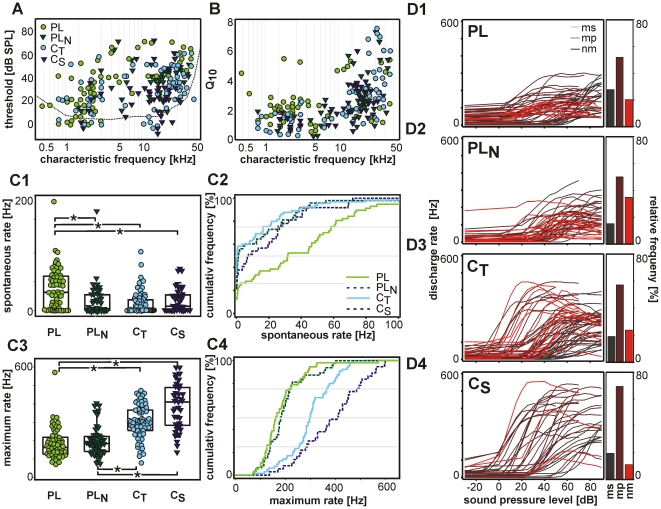
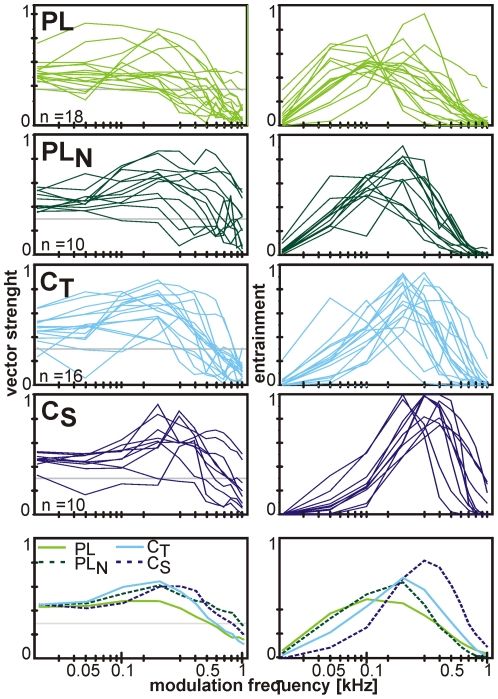
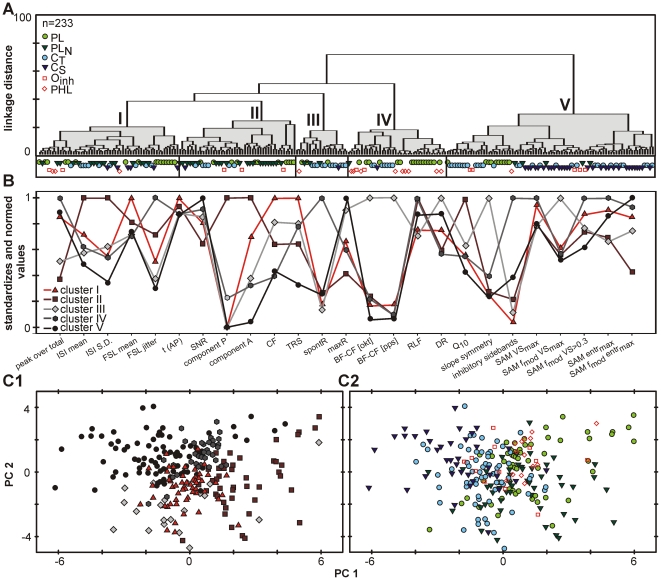
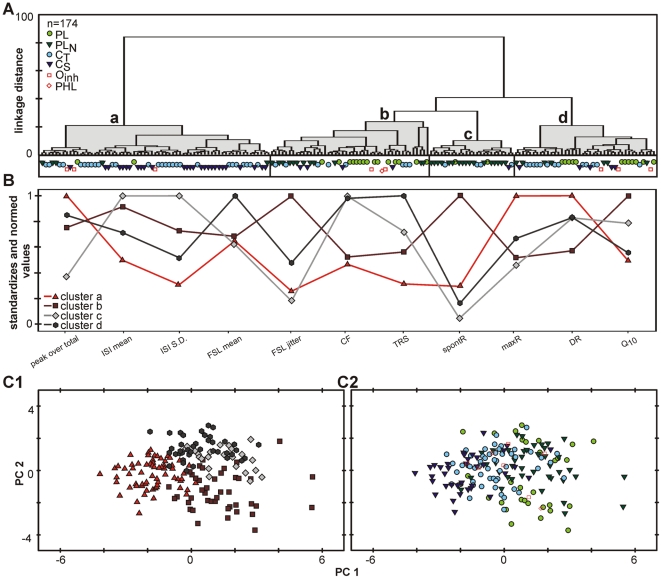
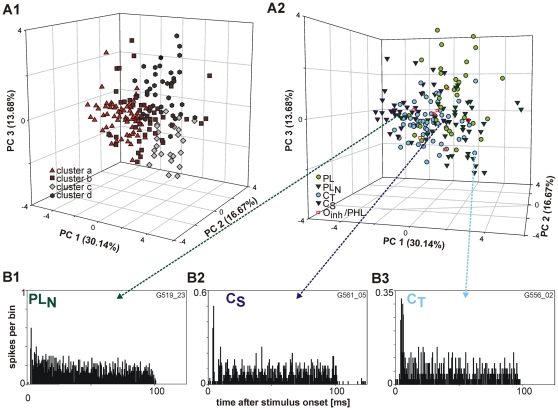
Multiple parallel auditory pathways ascend from the cochlear nucleus. It is generally accepted that the origin of these pathways are distinct groups of neurons differing in their anatomical and physiological properties. In extracellular in vivo recordings these neurons are typically classified on the basis of their peri-stimulus time histogram. In the present study we reconsider the question of classification of neurons in the anteroventral cochlear nucleus (AVCN) by taking a wider range of response properties into account. The study aims at a better understanding of the AVCN's functional organization and its significance as the source of different ascending auditory pathways. The analyses were based on 223 neurons recorded in the AVCN of the Mongolian gerbil. The range of analysed parameters encompassed spontaneous activity, frequency coding, sound level coding, as well as temporal coding. In order to categorize the unit sample without any presumptions as to the relevance of certain response parameters, hierarchical cluster analysis and additional principal component analysis were employed which both allow a classification on the basis of a multitude of parameters simultaneously. Even with the presently considered wider range of parameters, high number of neurons and more advanced analytical methods, no clear boundaries emerged which would separate the neurons based on their physiology. At the current resolution of the analysis, we therefore conclude that the AVCN units more likely constitute a multi-dimensional continuum with different physiological characteristics manifested at different poles. However, more complex stimuli could be useful to uncover physiological differences in future studies.
Conflict of interest statement
Figures
Similar articles
-
Neural encoding of single-formant stimuli in the cat. II. Responses of anteroventral cochlear nucleus units.J Neurophysiol. 1994 Jan;71(1):59-78. doi: 10.1152/jn.1994.71.1.59. J Neurophysiol. 1994. PMID: 8158242
-
Influence of inhibitory inputs on rate and timing of responses in the anteroventral cochlear nucleus.J Neurophysiol. 2008 Mar;99(3):1077-95. doi: 10.1152/jn.00708.2007. Epub 2008 Jan 16. J Neurophysiol. 2008. PMID: 18199821 Free PMC article.
-
Interaction of excitation and inhibition in anteroventral cochlear nucleus neurons that receive large endbulb synaptic endings.J Neurosci. 2002 Dec 15;22(24):11004-18. doi: 10.1523/JNEUROSCI.22-24-11004.2002. J Neurosci. 2002. PMID: 12486196 Free PMC article.
-
Spatiotemporal tuning of low-frequency cells in the anteroventral cochlear nucleus.J Neurosci. 1998 Feb 1;18(3):1096-104. doi: 10.1523/JNEUROSCI.18-03-01096.1998. J Neurosci. 1998. PMID: 9437029 Free PMC article.
-
Effects of furosemide on distortion product otoacoustic emissions and on neuronal responses in the anteroventral cochlear nucleus.J Neurophysiol. 1995 Oct;74(4):1628-38. doi: 10.1152/jn.1995.74.4.1628. J Neurophysiol. 1995. PMID: 8989399
Cited by
-
Inhibition in the auditory brainstem enhances signal representation and regulates gain in complex acoustic environments.Elife. 2016 Nov 18;5:e19295. doi: 10.7554/eLife.19295. Elife. 2016. PMID: 27855778 Free PMC article.
-
Functional Development of Principal Neurons in the Anteroventral Cochlear Nucleus Extends Beyond Hearing Onset.Front Cell Neurosci. 2019 Mar 28;13:119. doi: 10.3389/fncel.2019.00119. eCollection 2019. Front Cell Neurosci. 2019. PMID: 30983974 Free PMC article.
-
Fast Inhibition Slows and Desynchronizes Mouse Auditory Efferent Neuron Activity.J Neurosci. 2024 Aug 14;44(33):e0382242024. doi: 10.1523/JNEUROSCI.0382-24.2024. J Neurosci. 2024. PMID: 38937103 Free PMC article.
-
Principal cells of the brainstem's interaural sound level detector are temporal differentiators rather than integrators.Elife. 2018 Jun 14;7:e33854. doi: 10.7554/eLife.33854. Elife. 2018. PMID: 29901438 Free PMC article.
-
High-resolution volumetric imaging constrains compartmental models to explore synaptic integration and temporal processing by cochlear nucleus globular bushy cells.Elife. 2023 Jun 8;12:e83393. doi: 10.7554/eLife.83393. Elife. 2023. PMID: 37288824 Free PMC article.
References
-
- Thompson AM, Schofield BR. Afferent projections of the superior olivary complex. Microsc Res Tech. 2000;51:330–354. doi: 10.1002/1097-0029(20001115)51:4<330::AID-JEMT4>3.0.CO;2-X. - DOI - PubMed
-
- Eggermont JJ. Between sound and perception: reviewing the search for a neural code. Hear Res. 2001;157:1–42. - PubMed
-
- Cant NB, Benson CG. Parallel auditory pathways: projection patterns of the different neuronal populations in the dorsal and ventral cochlear nuclei. Brain Res Bull. 2003;60:457–474. - PubMed
-
- Osen KK. Cytoarchitecture of the cochlear nuclei in the cat. J Comp Neurol. 1969;136:453–484. doi: 10.1002/cne.901360407. - DOI - PubMed
-
- Brawer JR, Morest DK, Kane EC. The neuronal architecture of the cochlear nucleus of the cat. J Comp Neurol. 1974;155:251–300. doi: 10.1002/cne.901550302. - DOI - PubMed
Publication types
MeSH terms
LinkOut - more resources
Full Text Sources
