Expression profiles of human interferon-alpha and interferon-lambda subtypes are ligand- and cell-dependent
- PMID: 22249201
- PMCID: PMC3442264
- DOI: 10.1038/icb.2011.109
Expression profiles of human interferon-alpha and interferon-lambda subtypes are ligand- and cell-dependent
Erratum in
- Immunol Cell Biol. 2013 Oct;91(9):593
Abstract
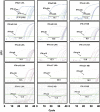
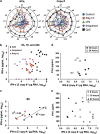
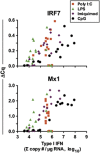
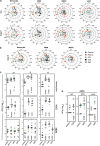
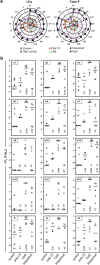
Recent genome-wide association studies suggest distinct roles for 12 human interferon-alpha (IFN-α) and 3 IFN-λ subtypes that may be elucidated by defining the expression patterns of these sets of genes. To overcome the impediment of high homology among each of the sets, we designed a quantitative real-time PCR assay that incorporates the use of molecular beacon and locked nucleic acid (LNA) probes, and in some instances, LNA oligonucleotide inhibitors. We then measured IFN subtype expression by human peripheral blood mononuclear cells and by purified monocytes, myeloid dendritic cells (mDC), plasmacytoid dendritic cells (pDC), and monocyte-derived macrophages (MDM), and -dendritic cells (MDDC) in response to poly I:C, lipopolysaccharide (LPS), imiquimod and CpG oligonucleotides. We found that in response to poly I:C and LPS, monocytes, MDM and MDDC express a subtype pattern restricted primarily to IFN-β and IFN-λ1. In addition, while CpG elicited expression of all type I IFN subtypes by pDC, imiquimod did not. Furthermore, MDM and mDC highly express IFN-λ, and the subtypes of IFN-λ are expressed hierarchically in the order IFN-λ1 followed by IFN-λ2, and then IFN-λ3. These data support a model of coordinated cell- and ligand-specific expression of types I and III IFN. Defining IFN subtype expression profiles in a variety of contexts may elucidate specific roles for IFN subtypes as protective, therapeutic or pathogenic mediators.
Figures
Similar articles
-
Viral infection and Toll-like receptor agonists induce a differential expression of type I and lambda interferons in human plasmacytoid and monocyte-derived dendritic cells.Eur J Immunol. 2004 Mar;34(3):796-805. doi: 10.1002/eji.200324610. Eur J Immunol. 2004. PMID: 14991609
-
TLR ligands induce synergistic interferon-β and interferon-λ1 gene expression in human monocyte-derived dendritic cells.Mol Immunol. 2011 Jan;48(4):505-15. doi: 10.1016/j.molimm.2010.10.005. Epub 2010 Oct 30. Mol Immunol. 2011. PMID: 21040977
-
Type I Interferons Function as Autocrine and Paracrine Factors to Induce Autotaxin in Response to TLR Activation.PLoS One. 2015 Aug 27;10(8):e0136629. doi: 10.1371/journal.pone.0136629. eCollection 2015. PLoS One. 2015. PMID: 26313906 Free PMC article.
-
Human blood dendritic cell antigen 3 (BDCA3)(+) dendritic cells are a potent producer of interferon-λ in response to hepatitis C virus.Hepatology. 2013 May;57(5):1705-15. doi: 10.1002/hep.26182. Epub 2013 Mar 14. Hepatology. 2013. PMID: 23213063
-
Comparative analysis of IRF and IFN-alpha expression in human plasmacytoid and monocyte-derived dendritic cells.J Leukoc Biol. 2003 Dec;74(6):1125-38. doi: 10.1189/jlb.0603255. Epub 2003 Sep 2. J Leukoc Biol. 2003. PMID: 12960254
Cited by
-
Hyperbaric hyperoxia exposure in suppressing human immunodeficiency virus replication: An experimental in vitro in peripheral mononuclear blood cells culture.Infect Dis Rep. 2020 Jul 7;12(Suppl 1):8743. doi: 10.4081/idr.2020.8743. eCollection 2020 Jul 7. Infect Dis Rep. 2020. PMID: 32874469 Free PMC article.
-
IRF1 Maintains Optimal Constitutive Expression of Antiviral Genes and Regulates the Early Antiviral Response.Front Immunol. 2019 May 15;10:1019. doi: 10.3389/fimmu.2019.01019. eCollection 2019. Front Immunol. 2019. PMID: 31156620 Free PMC article.
-
Defective Influenza A Virus RNA Products Mediate MAVS-Dependent Upregulation of Human Leukocyte Antigen Class I Proteins.J Virol. 2020 Jun 16;94(13):e00165-20. doi: 10.1128/JVI.00165-20. Print 2020 Jun 16. J Virol. 2020. PMID: 32321802 Free PMC article.
-
Plasmacytoid dendritic cells of the gut: relevance to immunity and pathology.Clin Immunol. 2014 Jul;153(1):165-77. doi: 10.1016/j.clim.2014.04.007. Epub 2014 Apr 24. Clin Immunol. 2014. PMID: 24769378 Free PMC article. Review.
-
Review of Lambda Interferons in Hepatitis B Virus Infection: Outcomes and Therapeutic Strategies.Viruses. 2021 Jun 9;13(6):1090. doi: 10.3390/v13061090. Viruses. 2021. PMID: 34207487 Free PMC article. Review.
References
-
- Dusheiko G. Side effects of alpha interferon in chronic hepatitis C. Hepatology. 1997;26:112S–121S. - PubMed
-
- Koyama Y, Tanaka Y, Oda S, Yamashita U, Eto S. Antiviral and antiproliferative activities of recombinant human interferon alpha 2, beta and gamma on HTLV-I and ATL cells in vitro. J UOEH. 1990;12:149–161. - PubMed
-
- Witter F, Barouki F, Griffin D, Nadler P, Woods A, Wood D, et al. Biologic response (antiviral) to recombinant human interferon alpha 2a as a function of dose and route of administration in healthy volunteers. Clin Pharmacol Ther. 1987;42:567–575. - PubMed
Publication types
MeSH terms
Substances
Grants and funding
LinkOut - more resources
Full Text Sources
Other Literature Sources

