. 2012 Jan 24;22(2):103-12.
doi: 10.1016/j.cub.2011.12.015. Epub 2012 Jan 12.

The HSF-like transcription factor TBF1 is a major molecular switch for plant growth-to-defense transition

Affiliations

The HSF-like transcription factor TBF1 is a major molecular switch for plant growth-to-defense transition

Karolina M Pajerowska-Mukhtar et al. Curr Biol. .

Abstract

Background: Induction of plant immune responses involves significant transcription reprogramming that prioritizes defense over growth-related cellular functions. Despite intensive forward genetic screens and genome-wide expression-profiling studies, a limited number of transcription factors have been found that regulate this transition.

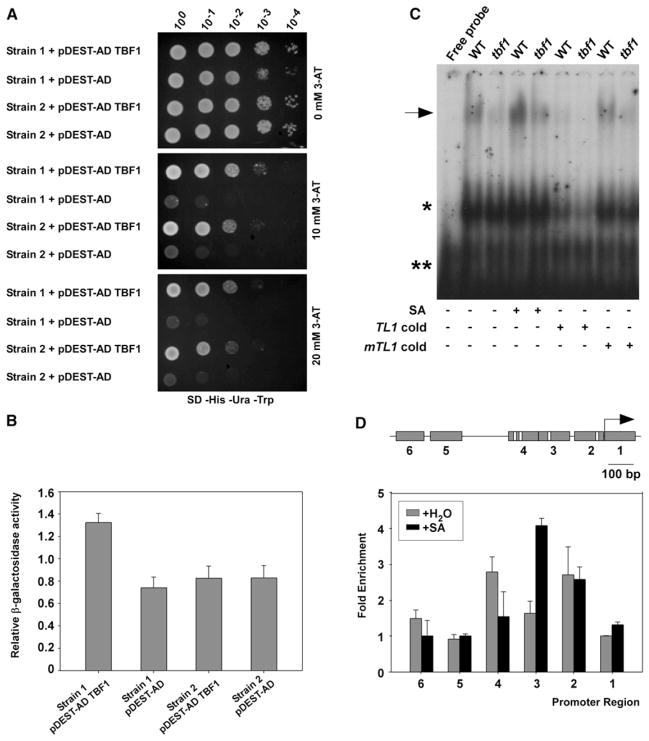
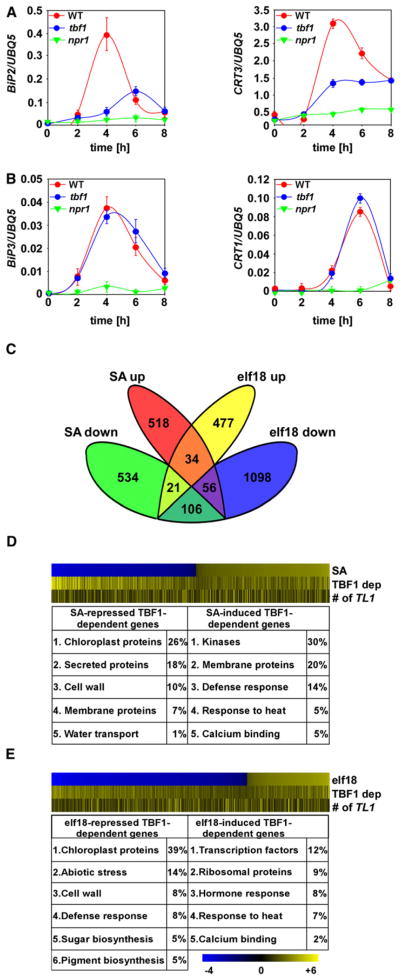
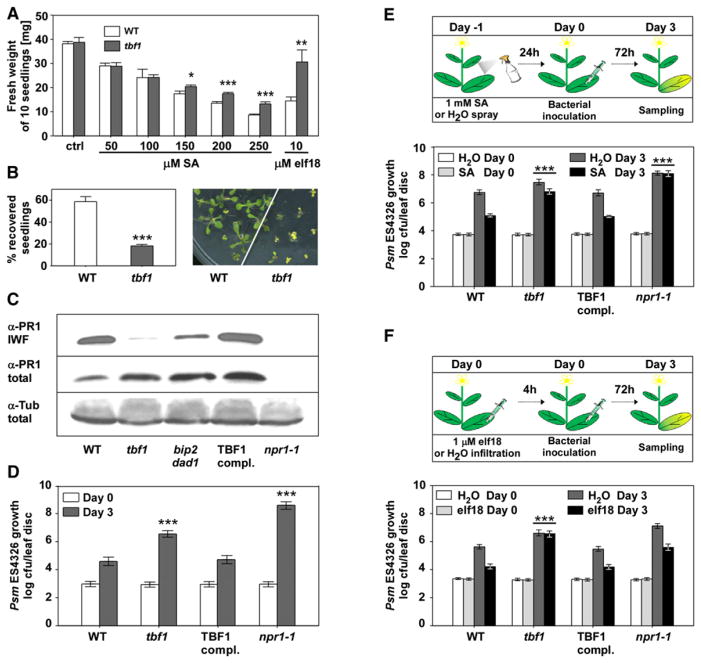
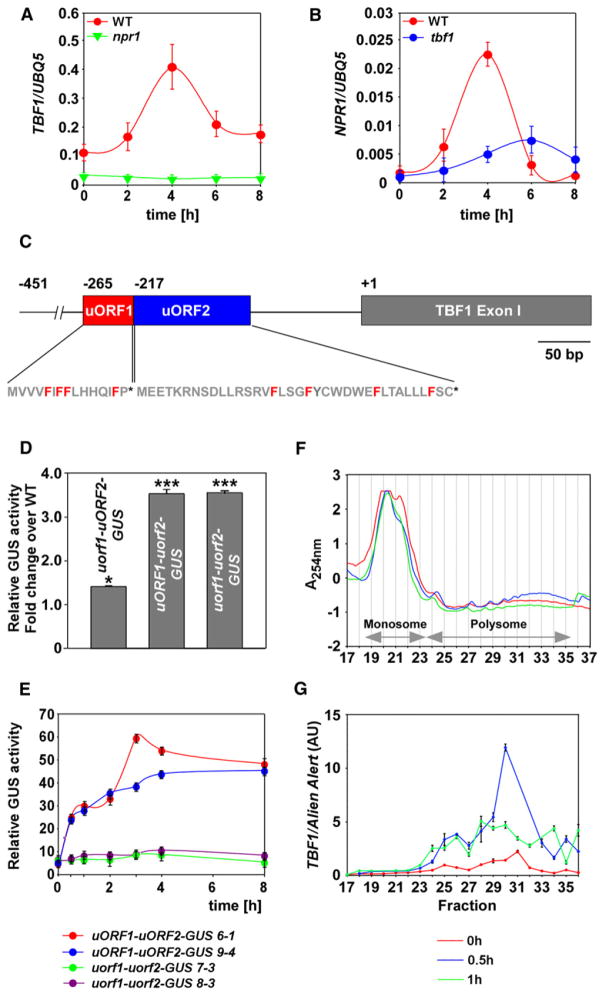
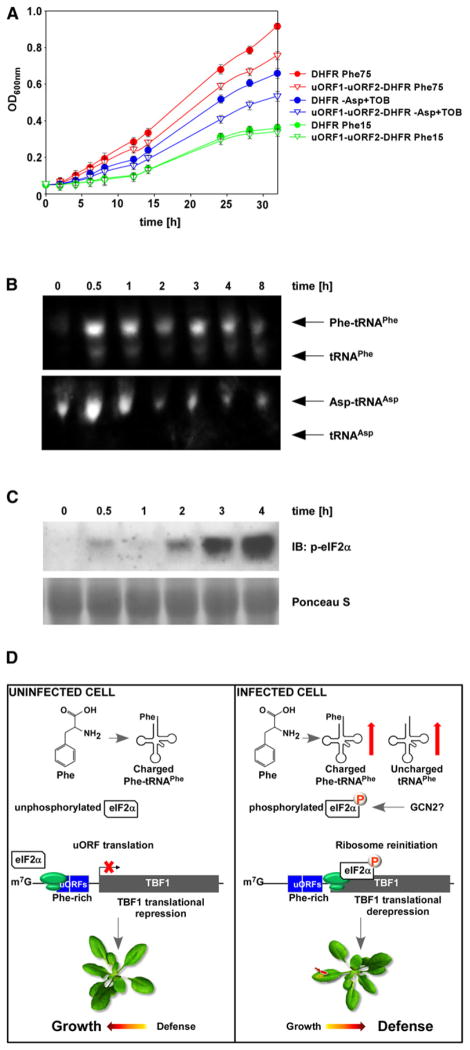
Results: Using the endoplasmic-reticulum-resident genes required for antimicrobial protein secretion as markers, we identified a heat-shock factor-like transcription factor that specifically binds to the TL1 (GAAGAAGAA) cis element required for the induction of these genes. Surprisingly, plants lacking this TL1-binding factor, TBF1, respond normally to heat stress but are compromised in immune responses induced by salicylic acid and by microbe-associated molecular pattern, elf18. Genome-wide expression profiling indicates that TBF1 plays a key role in the growth-to-defense transition. Moreover, the expression of TBF1 itself is tightly regulated at both the transcriptional and translational levels. Two upstream open reading frames encoding multiple aromatic amino acids were found 5' of the translation initiation codon of TBF1 and shown to affect its translation.

Conclusions: Through this unique regulatory mechanism, TBF1 can sense the metabolic changes upon pathogen invasion and trigger the specific transcriptional reprogramming through its target genes expression.


Figures

Figure 1
Figure 1. HSF4 Is the TL1-Binding TF, TBF1
(A and B) TBF1 (HSF4) binding to the TL1 cis elements in the BiP2 promoter was detected in Y1H. Yeast growth on selective media (SD-His-Ura-Trp) supplemented with increasing concentrations of 3-AT was recorded at day 3 (A). β-galactosidase reporter activity was measured using ONPG as the substrate (B). Error bars represent standard deviation from three different technical replications. Both (A) and (B) were repeated three times with similar results. See also Figures S1A and S1B. (C) Electrophoretic mobility shift assay was performed using plant extracts from WT and the tbf1 mutant upon 1 mM SA treatment. TL1 cold and mTL1 cold (mutant TL1; both at 5 pmol/μL) were used as unlabeled probes. The arrow marks the TBF-TL1 complex. Asterisks indicate nonspecific binding. (+) and (−) signify for the presence or absence of corresponding treatments. The experiment was repeated three times with similar results. See also Figures S1Cand S1D. (D) TBF1-GFP binding to the TL1 elements in the BiP2 promoter was measured by ChIP after treatment with H2O or 1mMSA. The PCR amplicons, 1 to 6 (gray boxes) with TL1 elements highlighted in white are shown (upper panel). Arrow represents the BiP2 translational start site. Normalized fold enrichment for each amplicon was calculated (lower panel). Error bars represent standard deviation from three different replicates. Experiment was repeated five times with similar results. See also Figure S1E.
Figure 2
Figure 2. TBF1 Plays aMajor Role in Transcriptional Reprogramming during MTI and SAR
(A and B) Relative transcript levels of TBF1-dependent and independent ER-resident genes were determined by qRT-PCR using cDNA generated from WT, tbf1, and npr1-1 plants treated with 1mMSA. Error bars represent standard deviation from nine technical replicates derived from three independent experiments. See also Figure S2A. (C) Venn diagram shows the numbers of TBF1-dependent SA downregulated (SA down), SA upregulated (SA up), elf18 upregulated (elf18 up), and elf18 downregulated (elf18 down) genes (p < 0.05). (D and E) Heat maps of TBF1-regulated genes in total numbers (top), degrees of TBF1 dependency (middle), and numbers of TL1 cis elements in the gene promoters (bottom) in response to SA (D) and elf18 (E) treatment. Top ranked functional groups were determined using DAVID Gene Ontology. Scale indicates the log-transformed p values of down-(blue) and up-(yellow) regulated genes (top), yellow lines indicate TBF1 dependency (middle), and yellow lines correspond to the numbers of TL1 cis elements in the gene promoters (bottom). See also Figures S2B–S2E.
Figure 3
Figure 3. TBF1 Is a Major Molecular Switch for the Growth-to-Defense Transition
(A) Fresh weight of ten seedlings grown for 10 days on plates with MS growth media (ctrl), or MS supplemented with increasing concentrations of SA or 10 μM elf18. Error bars represent standard deviation of three replicates. This experiment was repeated three times with similar results. Statistical analysis was performed using Student’s t test, *p < 0.05, **p < 0.01, ***p ≤ 0.001. See also Figure S3A. (B) Seedling recovery after treatment with tunicamycin was measured by counting the percentage of surviving seedlings (left) and by phenotype observations (right). Error bars represent standard deviation of three replicates. This experiment was repeated five times with similar results. Statistical analysis was performed using Student’s t test, ***p ≤ 0.001. See also Figure S3B. (C) PR1 accumulation in the intercellular wash fluid (IWF) and total protein extracts from leaves of 3-week-old WT, tbf1, tbf1 transformed with the WT TBF1 gene (TBF1 compl.), npr1-1, and bip2 dad2. For loading controls, an antibody against tubulin (α-Tub) was used to probe the total protein blot. See also Figure S3C. (D) Enhanced disease susceptibility was measured in 3-week-old WT, tbf1, TBF1 complementation, and npr1-1 plants 3 days after infiltration with a bacterial suspension of Psm ES4326 (OD600nm = 0.0001). Error bars represent 95% confidence intervals of 24 replicates derived from three independent experiments. This experiment was repeated at least five times with similar results. Statistical analysis was performed using Bonferroni post hoc test, ***p < 0.0001. (E) SA-induced resistance was determined according to the schematic representation (upper panel), and the growth of Psm ES4326 was plotted as in (D) but with a higher initial inoculum (OD600nm = 0.001) (lower panel). Error bars represent 95% confidence intervals of 24 replicates derived from three independent experiments. Statistical analysis was performed using two-way analysis of variance (ANOVA), ***p < 0.0001. (F) elf18-induced resistance was measured according to the schematic representation (upper panel) and with the initial Psm ES4326 inoculum of OD600nm = 0.001 (lower panel). Error bars represent 95% confidence intervals of 24 replicates derived from three independent experiments. Statistical analysis was performed using two-way ANOVA, ***p < 0.0001. See also Figures S3D and S3E.
Figure 4
Figure 4. TBF1 Expression Is Regulated at both Transcriptional and Translational Levels
(A and B) Relative transcript levels of TBF1 (A) and NPR1 (B) genes in response to 1 mM SA treatment were determined by qRT-PCR. Error bars represent standard deviation from nine technical replicates derived from three independent experiments. (C) Schematic representation of uORF1 and uORF2 and exon I of TBF1. The phenylalanines (F) in uORF1 and uORF2 are highlighted in red, and the stop codons are shown as asterisks. “+1” represents the translational start of TBF1 and −451, −265, and −217 represent the upstream positions of the 5′ end of the transcript, the start codon for uORF1, and the start codon for uORF2, respectively. (D) Quantification of GUS activity in Nicotiana benthamiana leaves transiently expressing uORF1-uORF2-GUS (WT), uorf1-uORF2-GUS, uORF1-uorf2-GUS, and uorf1-uorf2-GUS. This experiment has been repeated three times with similar results. (E) Quantification of translational inhibitory effect exerted by uORFs in transgenic T3 plants expressing uORF1-uORF2-GUS (two independent transformants 6-1 and 9-4) or uorf1-uorf2-GUS (two independent transformants 7-3 and 8-3) at various time points after inoculation with Psm ES4326/avrRpt2 (OD600nm = 0.02). Error bars represent standard deviation from three different replicates. Experiment was repeated at least three times with similar results. (F and G) Polysome profiles (F) and TBF1 expression (G) in samples obtained from WT plants at 0, 0.5, and 1 hr after inoculation with Psm ES4326/avrRpt2 (OD600nm = 0.02). The fractions containing monosome and polysome were annotated based on the absorbance at 254 nm (A254nm). The TBF1 transcript abundance normalized against Alien Alert® control transcript is expressed in arbitrary units (AU). Error bars represent standard error. This experiment was repeated using two biological replicates (each with three technical replicates) with similar results. See also Figure S4.
Figure 5
Figure 5. TBF1 Translation Is Regulated in Response to Pathogen-Induced Changes in Phenylalanine Metabolism
(A) The effects of phenylalanine and aspartate starvation on the translational inhibitory function of uORFs were measured by growth of the yeast strain aro7 (phe, tyr) transformed with the uORF1-uORF2-DHFR or DHFR reporter in medium containing methotrexate, an inhibitor of the endogenous DHFR. Optical densities for cultures containing two different concentrations of phenylalanine (Phe; 15 and 75 mg/L) as well as cultures lacking Asp and supplemented with tobramycin (TOB), an inhibitor of yeast tRNAAsp aspartylation, were recorded over the course of 32 hr. Error bars represent standard deviation from nine technical replicates derived from three independent experiments. See also Figure S5. (B) tRNA analysis of WT plants at various time points after inoculation with Psm ES4326/avrRpt2 (OD600nm = 0.02). Northern blot using probes against tRNAPhe or tRNAAsp was performed to detect charged and uncharged tRNAPhe or tRNAAsp. This experiment was repeated using three biological replicates with similar results. (C) Phosphorylated form of eIF2α was detected using a phospho-specific antibody in the total protein extracts from leaves of 3-week-old WT plants collected at various time points after inoculation with Psm ES4326/avrRpt2 (OD600nm = 0.02). Ponceau S stain was used to determine equal loading. (D) A model illustrating the molecular mechanism by which the translation initiation of TBF1 is regulated through rapid increases in uncharged and charged tRNAPhe, phosphorylation of eIF2α, and ribosomal read-through of uORFs, leading to the growth-to-development transition.

Similar articles

Cited by

References

    1. Nishimura MT, Dangl JL. Arabidopsis and the plant immune system. Plant J. 2010;61:1053–1066. - PMC - PubMed
    1. Jones JD, Dangl JL. The plant immune system. Nature. 2006;444:323–329. - PubMed
    1. Wang D, Weaver ND, Kesarwani M, Dong X. Induction of protein secretory pathway is required for systemic acquired resistance. Science. 2005;308:1036–1040. - PubMed
    1. Durrant WE, Dong X. Systemic acquired resistance. Annu Rev Phytopathol. 2004;42:185–209. - PubMed
    1. Kwon C, Bednarek P, Schulze-Lefert P. Secretory pathways in plant immune responses. Plant Physiol. 2008;147:1575–1583. - PMC - PubMed

Publication types

MeSH terms

Associated data