. 2012 Jan;8(1):e1002466.
doi: 10.1371/journal.ppat.1002466. Epub 2012 Jan 5.

Molecular determinants and dynamics of hepatitis C virus secretion

Affiliations

Molecular determinants and dynamics of hepatitis C virus secretion

Kelly E Coller et al. PLoS Pathog. 2012 Jan.

Abstract

The current model of hepatitis C virus (HCV) production involves the assembly of virions on or near the surface of lipid droplets, envelopment at the ER in association with components of VLDL synthesis, and egress via the secretory pathway. However, the cellular requirements for and a mechanistic understanding of HCV secretion are incomplete at best. We combined an RNA interference (RNAi) analysis of host factors for infectious HCV secretion with the development of live cell imaging of HCV core trafficking to gain a detailed understanding of HCV egress. RNAi studies identified multiple components of the secretory pathway, including ER to Golgi trafficking, lipid and protein kinases that regulate budding from the trans-Golgi network (TGN), VAMP1 vesicles and adaptor proteins, and the recycling endosome. Our results support a model wherein HCV is infectious upon envelopment at the ER and exits the cell via the secretory pathway. We next constructed infectious HCV with a tetracysteine (TC) tag insertion in core (TC-core) to monitor the dynamics of HCV core trafficking in association with its cellular cofactors. In order to isolate core protein movements associated with infectious HCV secretion, only trafficking events that required the essential HCV assembly factor NS2 were quantified. TC-core traffics to the cell periphery along microtubules and this movement can be inhibited by nocodazole. Sub-populations of TC-core localize to the Golgi and co-traffic with components of the recycling endosome. Silencing of the recycling endosome component Rab11a results in the accumulation of HCV core at the Golgi. The majority of dynamic core traffics in association with apolipoprotein E (ApoE) and VAMP1 vesicles. This study identifies many new host cofactors of HCV egress, while presenting dynamic studies of HCV core trafficking in infected cells.


Conflict of interest statement

The authors have declared that no competing interests exist.

Figures

Figure 1
Figure 1. Characterization of tetracysteine (TC) tag insertion in core.
A. Replication data for WT (J6/JFH1) and TC-core viruses. Time points indicated. Error bar, standard deviation. B. Titer data for WT and TC-core viruses. Viral supernatants were collected at indicated timepoints and titered by limiting dilution assay. Shown are the averages of 4 sets of titer data. Error bar, standard deviation.
Figure 2
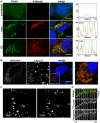
Figure 2. Characterization of TC-core puncta.
A. Huh-7.5 cells were electroporated with TC-core RNA. At 72 hours post electroporation (hpe), cells were stained with FlAsH (1.25 µM, green) then fixed and stained for immunofluorescence using anti-core or anti-E2 antibodies (red). Scale bar is 10 microns. Fluorescence profiles of lined area in A. Distance is in pixels and intensity is in arbitrary fluorescence units (AFU). Percent colocalization of FlAsH stained puncta positive for anti-core or anti-E2 per cell is shown is upper left corner of fluorescence profile. B. Huh-7.5 cells were infected with HCV for 72 hours, treated with Click-iT in the presence of actinomycin D (1 µg/mL) to detect RNA, fixed, and probed with core antibody. C. Left: Single frame of an acquired fluorescent timelapse where DsRed exposures were taken every 2 seconds. Right: Single frame image where 5 particles were tracked and the trajectories are superimposed. Elapsed time between images is 100 seconds. Video S1. Scale bar is 10 µm. D. TC-core RNAs were electroporated into Huh-7.5 cells, maintained for 72 hours, stained with ReAsh (red) and Ribogreen (1 µl/ml), and visualized by live cell fluorescence microscopy. A representative montage of TC-core puncta transporting with RNA is shown. Elapsed time is 1 minute and 50 seconds seconds and the distance traveled is approximately 8.32 µm. Video S12.
Figure 3
Figure 3. Construction and characterization of assembly mutants in TC-core background.
A. Drawing indicating insertion site of TC-tag into core after amino acid 3. Shown are the TC-core, bicistronic, and NS2 deletion (ΔNS2) viruses. B. Replication data for TC-core, bicistronic, and ΔNS2 viruses. Time points indicated. Error bar, standard deviation. C. Intra- and extra-cellular infectious virus production for TC-core, bicistronic, and ΔNS2 RNAs. Virus was collected at indicated timepoints and titered by limiting dilution assay. Dotted line indicates detection limit for titer assay. nd, not detectable. Error bar, standard deviation.
Figure 4
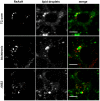
Figure 4. TC-core localizes to lipid droplets.
Huh-7.5 cells electroporated with TC-core, bicistronic, or ΔNS2 RNAs were stained with ReAsH dye (red) at 72 hours post electroporation and incubated with Bodipy-493/503 (green) to label lipid droplets. Scale bar is 10 microns.
Figure 5
Figure 5. Dynamic TC-core movements require HCV assembly.
Huh-7.5 cells were electroporated with TC-core, bicistronic, or ΔNS2 RNAs. Electroporated cells were stained at 72 hours post electroporation with the biarsenical dye ReAsH and imaged using timelapse confocal microscopy where DsRed (200 ms) exposures were taken every 2 seconds. A. Timelapse montages of TC-core puncta transport of the viruses imaged. Time on x-axis. Elapsed times are 40sec (TC-core), 40sec (bicistronic), 132sec (ΔNS2) and height (distance traveled) of each montage is 12.48 µm B. Quantification of percent of TC-core puncta displaying movement over 1 µm during the course of imaging. Values are shown as a percentage of total cellular TC-core puncta. n-values equal total number of TC-core puncta, error bars are standard error (of the proportions). Asterisk indicates p-value <0.0001. C. Distance from origin plots of TC-core viruses. The cumulative distance traveled by a TC-core puncta was measured and plotted against time. n-values indicate total TC-core puncta tracked.
Figure 6
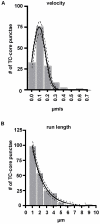
Figure 6. TC-core transport kinetics.
Huh7.5 cells were electroporated with TC-core RNA and stained with ReAsH dye at 72 hours post electroporation. Infected cells were imaged by acquiring 200ms exposures every 2 seconds for several minutes. A. Histogram of capsid transport velocities where the x-axis represents velocity in micrometers per second (µm/sec) and the y-axis represents the number of TC-core puncta. The solid curve represents the Gaussian best-fit curve, and the dashed lines indicate the 95% confidence interval. Goodness of fit, R2 = 0.9883. B. Histogram of individual capsid run lengths where the x-axis represents distance traveled in micrometers (µm) ad the y-axis represents the number of TC-core puncta. The solid curve represents the best-fit decaying exponential, and the dashed lines indicate the 95% confidence interval. Goodness of fit, R2 = 0.9924.
Figure 7
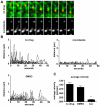
Figure 7. Movement of TC-core is microtubule dependent.
Huh-7.5 cells were electroporated with TC-core HCV RNA and at 72 hpe stained with ReAsH (red) followed by incubation with 200 nM TubulinTracker Green. Images were acquired by taking alternating 200 ms DsRed and 200 ms GFP exposures every 2 seconds. A. Top: Montage of TC-core (red) transport along microtubule (green). Elapsed time is 1 minute and the length of single frame is 9.76 µm. Below: TC-core infected cells stained with ReAsH and TubulinTracker Green and then treated with 8 ug/mL nocodazole immediately prior to imaging. Shown only is TC-core for simplicity, as there is low signal from the depolymerized microtubules. Elapsed time is 2 minutes 18 seconds. The length of the montage is 9.76 µm. B. Single particles from untreated, DMSO, or nocodazole treated cells were tracked and the distance (y-axis) versus time (x-axis) was plotted. Distance plots were constructed using ImageJ Manual Tracking plugin, which provides the instantaneous distance and velocity between two frames. Distance values were plotted versus time (x-axis). C. The average velocities of tracked particles are shown. Error bars represent standard error of mean, asterisk indicates p-value <0.0001.
Figure 8
Figure 8. Localization of TC-core and markers of the TGN.
A. Huh-7.5 cells were electroporated with TC-core RNA and at 72 hours post infection cells were stained with ReAsH dye. Top panel: Cells were transduced with Golgi-GFP at 48 hours post electroporation then stained with ReAsH. Bottom panels: Cells were stained with ReAsH dye at 72 hours post electroporation and processed for immunofluorescence using an antibody directed against GM130. Arrows point to TC-core puncta colocalized with TGN markers. Scale bar is 10 µm. B. TC-core electroporated cells were incubated with DMSO, PIK93 (0.5 µM), or brefeldin A (BFA) (1 µg/ml) for 2 hours prior to ReAsh staining. Drugs were present in staining and imaging medias. Live cell imaging was performed and TC-core puncta were tracked. The average velocities were measured and are plotted. PIK93 or BFA treatment significantly reduced average velocity (unpaired Student's t-test).
Figure 9
Figure 9. TC-core HCV co-transports with host secretory pathway components.
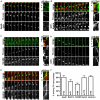
Huh-7.5 cells were electroporated with TC-core RNA followed by transfection at 48 hours post electroporation with either ApoE-GFP (A), GFP-Rab11A (B), or GFP-VAMP1 (D) then ReAsH (red) stained at 72hpe. Otherwise, cells were incubated with transferrin-488 (C) or dextran (E) prior to imaging by confocal microscopy at 72 hours post electroporation. Shown are montages of alternating DsRed (200ms) and EGFP (200ms) exposures taken every 2 seconds. Kymographs (distance on x-axis and time on y-axis) of TC-core and cellular markers are shown to the right of the montage. Straight line on the y-axis indicates stalled transport (time change only), whereas a diagonal line indicates transport (change in time and distance). Distance traveled and time elapsed (seconds) during video acquisition are indicated on the kymograph. Arrows indicate the part of the kymograph shown in montages (left). See supplemental section for videos. F. Quantification of TC-core puncta cotransport with cellular markers as a percentage of total TC-core puncta movers.
Figure 10
Figure 10. siRNA treatments inhibiting infectious virus production alter core sub-cellular localization.
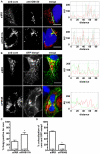
A. Huh7.5 cells were electroporated with irrelevant (siIRR) or Rab11a (siRab11a) siRNAs followed by infection with HCV at 48 hours post electroporation. Cells were fixed and stained with Golgi marker GM130 (green) and core (red) at 72 hours post infection. Immunofluorescence of siIRR (top) and siRab11a (bottom) treated cells expressing viral core. White line in merge image is profiled for fluorescence intensity. RBG profile where distance is in pixels and fluorescence intensity is in arbitrary fluorescence units (AU). Scale bar is 10 µm. B. Huh-7.5 cells electroporated with irrelevant (siIRR) or Pik4B (siPIK4B) siRNAs, then infected with HCV at 48hpe followed by transfection with GFP-Vamp1 (green) at 72hpe. Cells were maintained for one day, then fixation and stained with anti-core antibody (red). Top: siIRR treatment. Bottom. si-PI4KB treatment. RBG profile where distance is in pixels and fluorescence intensity is in arbitrary fluorescence units (AU). Scale bar is 10 µm. C. Quantitation of core-GM130 colocalization in (A). Asterisk indicates p-value <.01. D. Quantitation of core Vamp1-GFP colocalization in (B). Asterisk indicates p-value <.0001.

Similar articles

Cited by

References

    1. Lindenbach BD, Evans MJ, Syder AJ, Wolk B, Tellinghuisen TL, et al. Complete replication of hepatitis C virus in cell culture. Science. 2005;309:623–626. - PubMed
    1. Lindenbach BD, Meuleman P, Ploss A, Vanwolleghem T, Syder AJ, et al. Cell culture-grown hepatitis C virus is infectious in vivo and can be recultured in vitro. Proc Natl Acad Sci U S A. 2006;103:3805–3809. - PMC - PubMed
    1. Wakita T, Pietschmann T, Kato T, Date T, Miyamoto M, et al. Production of infectious hepatitis C virus in tissue culture from a cloned viral genome. Nat Med. 2005;11:791–796. - PMC - PubMed
    1. Zhong J, Gastaminza P, Cheng G, Kapadia S, Kato T, et al. Robust hepatitis C virus infection in vitro. Proc Natl Acad Sci U S A. 2005;102:9294–9299. - PMC - PubMed
    1. Bartosch B, Dubuisson J, Cosset FL. Infectious hepatitis C virus pseudo-particles containing functional E1-E2 envelope protein complexes. J Exp Med. 2003;197:633–642. - PMC - PubMed

Publication types

MeSH terms

Substances