. 2012 Feb 1;8(2):236-51.
doi: 10.4161/auto.8.2.18600. Epub 2012 Feb 1.

Autophagy-dependent senescence in response to DNA damage and chronic apoptotic stress

Affiliations

Autophagy-dependent senescence in response to DNA damage and chronic apoptotic stress

Kamini Singh et al. Autophagy. .

Abstract

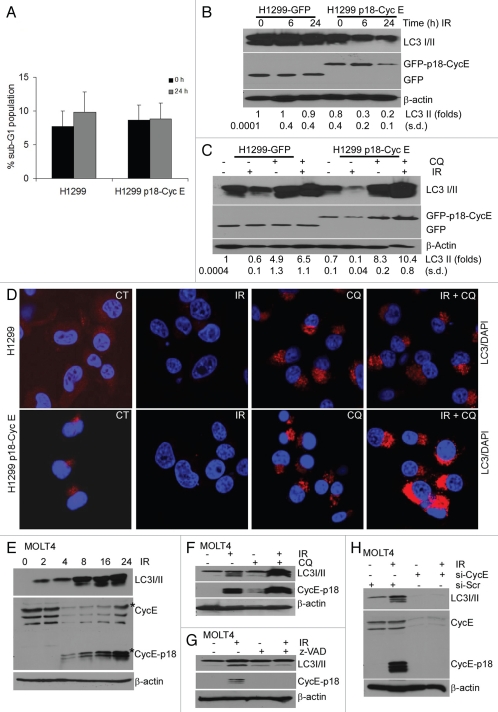
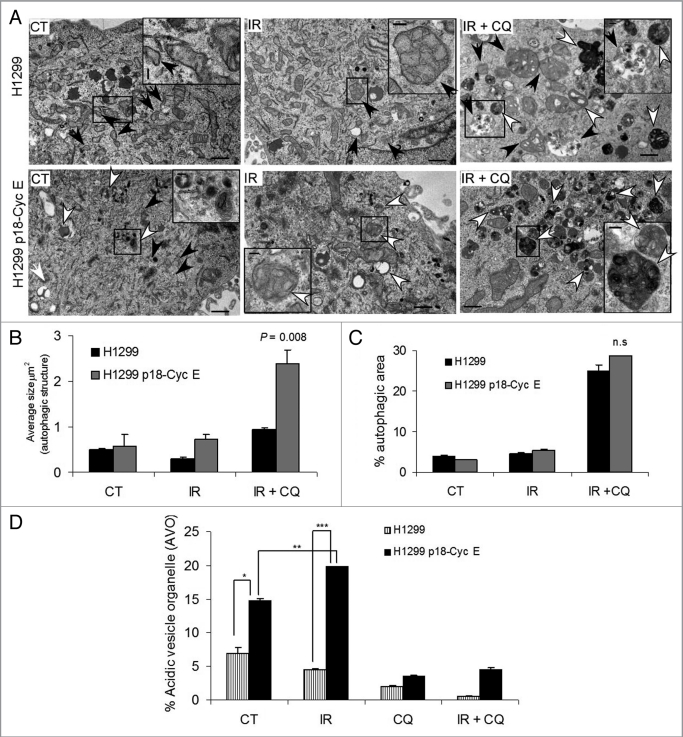
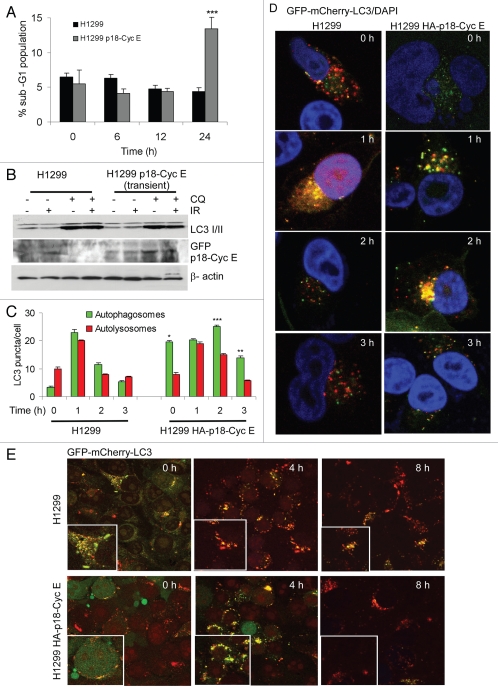
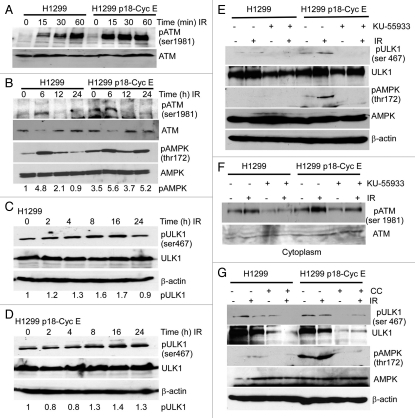
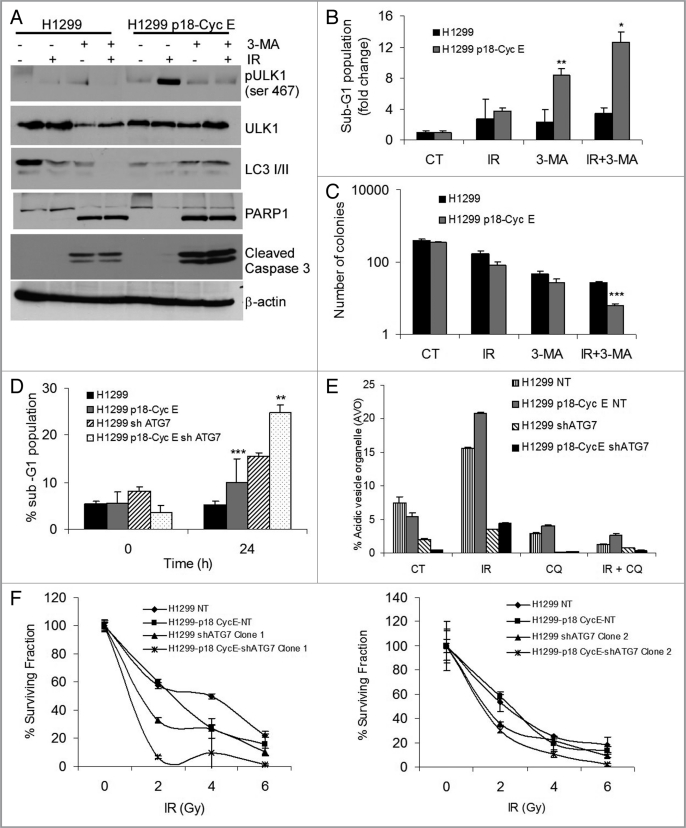
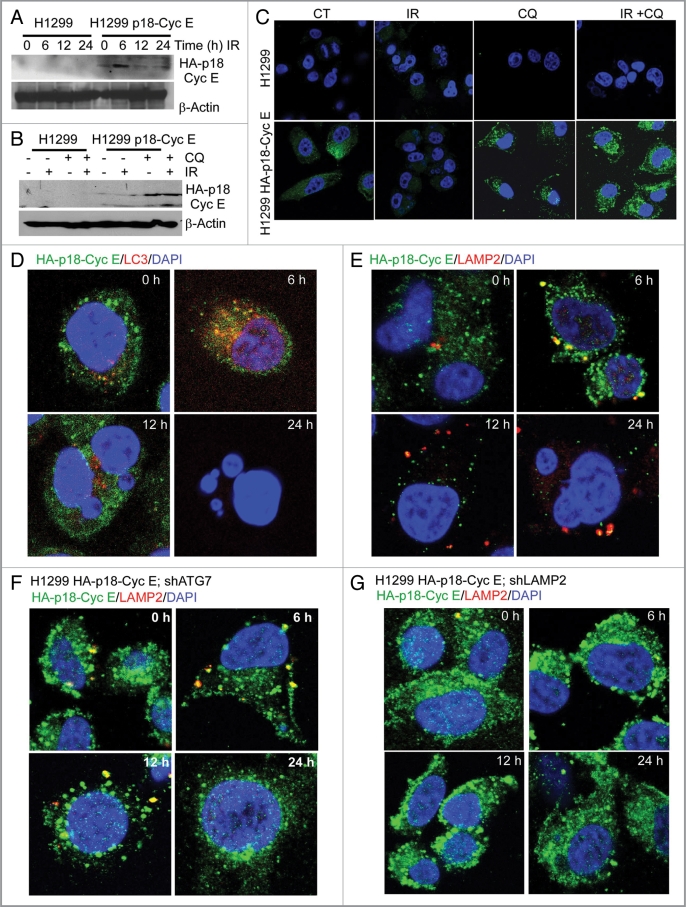
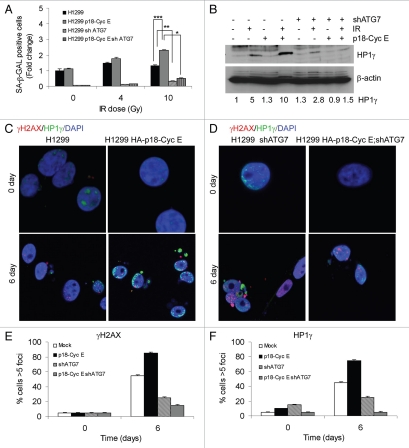
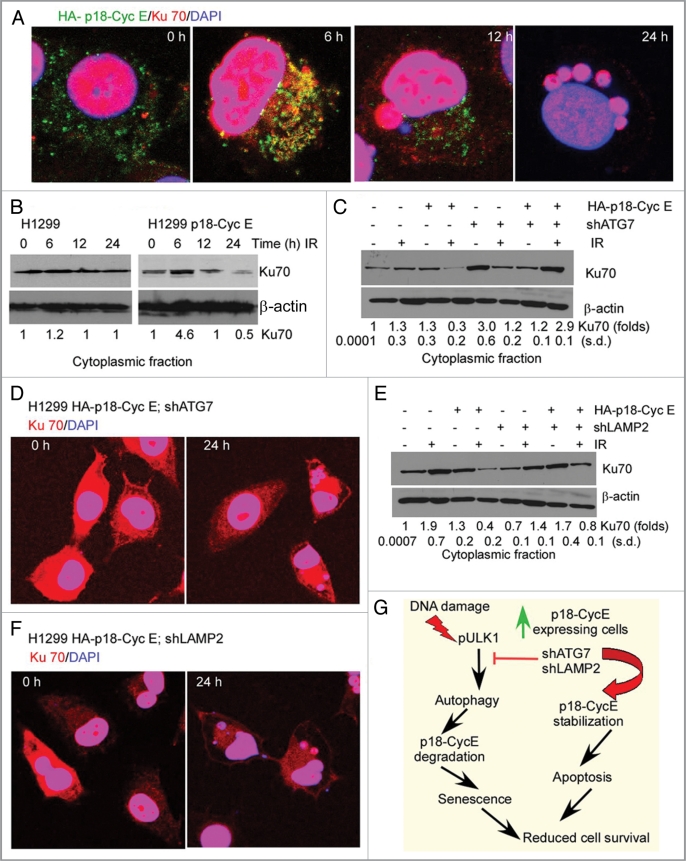
Autophagy regulates cell survival and cell death upon various cellular stresses, yet the molecular signaling events involved are not well defined. Here, we established the function of a proteolytic Cyclin E fragment (p18-CycE) in DNA damage-induced autophagy, apoptosis, and senescence. p18-CycE was identified in hematopoietic cells undergoing DNA damage-induced apoptosis. In epithelial cells exposed to DNA damage, chronic but not transient expression of p18-CycE leads to higher turnover of LC3 I/II and increased emergence of autophagosomes and autolysosomes. Levels of p18-CycE, which was generated by proteolytic cleavage of endogenous Cyclin E, were greatly increased by chloroquine and correlated with LC 3II conversion. Preventing p18-CycE genesis blocked conversion of LC3 I to LC3 II. Upon DNA damage, cytoplasmic ataxia-telangiectasia-mutated (ATM) was phosphorylated in p18-CycE-expressing cells resulting in sustained activation of the adenosine-mono-phosphate-dependent kinase (AMPK). These lead to sustained activation of mammalian autophagy-initiating kinase ULK1, which was abrogated upon inhibiting ATM and AMPK phosphorylation. Moreover, p18-CycE was degraded via autophagy followed by induction of senescence. Both autophagy and senescence were prevented by inhibiting autophagy, which leads to increased apoptosis in p18-CycE-expressing cells by stabilizing p18-CycE expression. Senescence was further associated with cytoplasmic co-localization and degradation of p18-CycE and Ku70. In brief, chronic p18-CycE expression-induced autophagy leads to clearance of p18-CycE following DNA damage and induction of senescence. Autophagy inhibition stabilized the cytoplasmic p18-CycE-Ku70 complex leading to apoptosis. Thus, our findings define how chronic apoptotic stress and DNA damage initiate autophagy and regulate cell survival through senescence and/or apoptosis.


Figures

Figure 1
Figure 1
DNA damage-induced autophagy is enhanced in p18-CycE-expressing cells. (A) Parental and p18-CycE expressing NCI-H1299 cells were harvested, fixed, and stained with propidium iodide at 24 h following treatment with ionizing radiation (IR). Cell death is shown as percentage of cells with sub-G1 DNA content. (B and C) Cells were lysed at the indicated time following irradiation and/or chloroquine (100 µM) treatment and immunoblotted for LC3 I/II, GFP, GFP-p18-CycE and β-actin as a loading control. Fold change in LC3 II is indicated (D) Visualization of endogenous LC3 I/II at 24 h following IR in the absence or presence of chloroquine. Nuclei were stained with 4;6-diamidino-2-phenylindole (DAPI). (E) Western blot analysis for endogenous LC3 I/II and p18-CycE in MOLT4 cells at the indicated time following IR. (F and G) Western blot analysis for endogenous LC 3I/II and p18-CycE in MOLT4 cells at 16 h following IR in the absence or presence of chloroquine or z-VAD-fmk (10 µM). (H) Western blot analysis for endogenous LC3 I/II and p18-CycE in MOLT4 cells irradiated for 16 h after 24 h post-transfection with scrambled siRNA (si-Scr) or si-RNA against Cyclin E. β-actin served as loading control.
Figure 2
Figure 2
Autophagic area and flux is enhanced in p18-CycE-expressing cells following DNA-damage. (A) Transmission electron microscopic analysis of autophagic structures at 24 h post irradiation in the absence or presence of chloroquine. Early and late autophagic structures are indicated by black and white arrows, respectively, with black box regions enlarged in the inset. The scale bar in the original image represents 1 µm and the scale bar in the inset represents 200 nm. (B,C) Quantitative analysis for the average size of autophagic structures (*p = 0.008) and fraction of autophagic area normalized to cytoplasmic area (n.s). Data represent means ± s.e.m., with more than three different fields analyzed per sample. (D) Detection of acidic vesicular organelles (AVOs) by measuring red and green fluorescence of acridine orange-stained cells using FACS analysis in parental and p18-CycE expressing cells at 24 h following IR and/or chloroquine treatment (*p = 0.007, **p = 0.002, ***p < 0.001). Data represent means ± s.e.m., obtained from three independent triplicates.
Figure 3
Figure 3
Stable, but not transient p18-CycE expression leads to increased autophagy. (A) Cell death is shown as percentage of cells with sub-G1 DNA content in cells transiently transfected with p18-CycE following IR (*p < 0.001 compared for p18-CycE-expressing cells vs. parental cells at 24 h) Student's t-test. (B) Cells were lysed at 24 h post IR in the absence or presence of chloroquine and immunoblotted for LC3 I/II, GFP-p18-CycE, with β-actin as loading control. (C) Quantitation of autophagosomal (yellow) and autolysosomal (red) LC3 puncta following irradiation. **p = 0.017, *p = 0.0006, ***p = 0.03 Student's t-test. For all panels, values are mean ± s.e.m. with > 30 cells from different fields analyzed per sample. (D) Autophagic flux is shown by representative confocal microscopic images for cells stably-expressing GFP-mCherry-LC3 in cells without or those expressing HA-p18-CycE. (E) Representative confocal images are shown for cells stably expressing GFP-mCherry-LC3 without or with transient expression of HA-p18-CycE at the indicated times following IR.
Figure 4
Figure 4
DNA damage induces sustained activation of AMPK and ULK1 in p18-CycE-expressing cells. (A and B) Cytoplasmic fractions of cells, at the indicated time following IR, were immunoblotted for ATM-ser1981, ATM, pAMPK-thr172, AMPK. β-actin was used as a loading control. (C and D) Total protein lysates of cells at the indicated time following IR were immunoblotted for pULK1-ser467, ULK1, and β-actin. (E) Total protein lysates of cells at 24 h following IR with or without 1 h pretreatment with the ATM inhibitor KU-55933 (10 µM) were immunoblotted for pULK1-ser467, ULK1, pAMPK-thr172, AMPK and β-actin. (F) Cytoplasmic fractions of cells at 6 h following IR with or without 1 h pretreatment with the ATM inhibitor KU-55933 (10 µM) were immunoblotted for ATM-ser1981 and ATM. (G) Total protein lysates of cells at 24 h following IR with or without 1 h pretreatment with the AMPK inhibitor Compound C (CC; 25 µM) were immunoblotted for pULK1-ser467, ULK1, pAMPK-thr172, AMPK and β-actin.
Figure 5
Figure 5
Autophagy inhibition increases apoptosis in p18-CycE-expressing cells. (A) Cells harvested and lysed at 24 h post IR in the absence or presence of 3-MA (10 mM) were immunoblotted for pULK1-ser467, ULK1, LC3 I/II, PARP1, cleaved caspase-3, and β-actin. (B) Cell death at 24 h following IR in the absence or presence of 3-MA (10 mM) treatment is shown as percentage of cells with sub-G1 DNA content. **p = 0.02, *p = 0.03 Student's t-test. (C) Clonogenic assay following IR (5 Gy) in the absence or presence of 3-MA. *p < 0.001 Student's t-test. (D) Cell death is shown as percentage of cells with sub-G1 DNA content that stably express p18-CycE in cells without or with shATG7 expression (Clone 1) at 24 h following IR. *p < 0.001, **p = 0.001 Student's t-test. (E) Detection of acidic vesicular organelles (AVOs) by measuring red and green fluorescence of acridine orange-stained cells using FACS analysis in parental and p18-CycE expressing cells with or without shATG7 expression following IR and/or chloroquine (100 µM) treatment for 24 h. Data represent means ± s.e.m., obtained from three independent triplicates. (F) Clonogenic assay for cells stably-expressing p18-CycE in the absence or presence of shATG7 (Clone 1 in left panel, Clone 2 in right panel) following IR. p < 0.05 Student's t-test. For all panels, values are mean ± s.e.m. of three independent experiments performed in triplicates.
Figure 6
Figure 6
Expression of p18-CycE is regulated by autophagy. (A) Total protein lysates were immunoblotted for HA-p18-CycE and β-actin at the indicated time following IR. (B) Cells were lysed at the indicated time following IR and/or chloroquine (100 µM) treatment and immunoblotted for HA-p18-CycE using anti-HA antibody and β-actin as loading control. (C) Confocal co-immunostaining for HA-p18-CycE in parental and p18-CycE-expressing cells at 24 h following IR with or without chloroquine. (D and E) Confocal co-immunostaining for HA-p18-CycE/LC3I/II and HA-p18-CycE/LAMP2 in cells stably-expressing p18-CycE at the indicated time following IR. (F and G) Confocal co-immunostaining for HA-p18-CycE/LAMP2 in p18-CycE-expressing cells with ATG7 or LAMP2 knockdown at the indicated time following IR. Nuclei were stained with DAPI.
Figure 7
Figure 7
DNA damage induces autophagy-dependent senescence in p18-CycE-expressing cells. (A) SA-β-Gal-positive, p18-CycE in the absence or presence of shATG7-expressing cells at 6 d post IR. ***p = 0.003, **p = 0.005, *p < 0.001 Student's t-test. Data represent means ± s.e.m. of three independent experiments done in triplicates. (B) Expression of HP1γ and β-actin in parental and p18-CycE expressing cells in the absence or presence of shATG7 at 6 d post IR. Fold change in HP1γ is indicated. (C and D) Visualization of endogenous HP1γ and γH2AX-associated foci by confocal immunostaining in parental and p18-CycE-expressing cells in the absence or presence of shATG7 expression following IR. (E and F) Percentage of cells having at least 5 foci per cell for γH2AX and HP1γ in parental and p18-CycE-expressing cells in the absence or presence of shATG7 expression following IR.
Figure 8
Figure 8
Coordinate cytoplasmic Ku70 and p18-CycE degradation leads to senescence. (A) Confocal co-immunostaining for HA-p18-CycE and Ku70 at 6–24 h following IR in HA-p18-CycE-expressing cells. (B) Cytoplasmic fractions of parental and p18-CycE expressing cells following IR at the indicated time were immunoblotted for Ku70 and β-actin. (C) Cytoplasmic fractions of p18-CycE-expressing cells with or without shATG7 expression at the indicated time following IR were immunoblotted for Ku70 and β-actin. (D) Confocal co-immunostaining for Ku70 in HA-p18-CycE-expressing cells in the absence or presence of shATG7 at 24 h following IR. Nuclei were stained with DAPI. (E) Cytoplasmic fractions of p18-CycE-expressing cells with or without shLAMP2 expression at the indicated time following IR were immunoblotted for Ku70 and β-actin. (F) Confocal co-immunostaining for Ku70 in HA-p18-CycE-expressing cells in the absence or presence of shLAMP2 at 24 h following IR. Nuclei were stained with DAPI. (G) Model for cell survival regulation by p18-CycE via autophagy, apoptosis, and senescence.

Similar articles

Cited by

  • Guidelines for the use and interpretation of assays for monitoring autophagy (4th edition)1.
    Klionsky DJ, Abdel-Aziz AK, Abdelfatah S, Abdellatif M, Abdoli A, Abel S, Abeliovich H, Abildgaard MH, Abudu YP, Acevedo-Arozena A, Adamopoulos IE, Adeli K, Adolph TE, Adornetto A, Aflaki E, Agam G, Agarwal A, Aggarwal BB, Agnello M, Agostinis P, Agrewala JN, Agrotis A, Aguilar PV, Ahmad ST, Ahmed ZM, Ahumada-Castro U, Aits S, Aizawa S, Akkoc Y, Akoumianaki T, Akpinar HA, Al-Abd AM, Al-Akra L, Al-Gharaibeh A, Alaoui-Jamali MA, Alberti S, Alcocer-Gómez E, Alessandri C, Ali M, Alim Al-Bari MA, Aliwaini S, Alizadeh J, Almacellas E, Almasan A, Alonso A, Alonso GD, Altan-Bonnet N, Altieri DC, Álvarez ÉMC, Alves S, Alves da Costa C, Alzaharna MM, Amadio M, Amantini C, Amaral C, Ambrosio S, Amer AO, Ammanathan V, An Z, Andersen SU, Andrabi SA, Andrade-Silva M, Andres AM, Angelini S, Ann D, Anozie UC, Ansari MY, Antas P, Antebi A, Antón Z, Anwar T, Apetoh L, Apostolova N, Araki T, Araki Y, Arasaki K, Araújo WL, Araya J, Arden C, Arévalo MA, Arguelles S, Arias E, Arikkath J, Arimoto H, Ariosa AR, Armstrong-James D, Arnauné-Pelloquin L, Aroca A, Arroyo DS, Arsov I, Artero R, Asaro DML, Aschner M, Ashrafizadeh M, Ashur-Fabian O, Atanasov AG, Au AK, Auberger P, Auner HW, Aurelian L, Autelli R… See abstract for full author list ➔ Klionsky DJ, et al. Autophagy. 2021 Jan;17(1):1-382. doi: 10.1080/15548627.2020.1797280. Epub 2021 Feb 8. Autophagy. 2021. PMID: 33634751 Free PMC article.
  • Autophagy through 4EBP1 and AMPK regulates oxidative stress-induced premature senescence in auditory cells.
    Tsuchihashi NA, Hayashi K, Dan K, Goto F, Nomura Y, Fujioka M, Kanzaki S, Komune S, Ogawa K. Tsuchihashi NA, et al. Oncotarget. 2015 Feb 28;6(6):3644-55. doi: 10.18632/oncotarget.2874. Oncotarget. 2015. PMID: 25682865 Free PMC article.
  • The DNA-damage response and nuclear events as regulators of nonapoptotic forms of cell death.
    Prokhorova EA, Egorshina AY, Zhivotovsky B, Kopeina GS. Prokhorova EA, et al. Oncogene. 2020 Jan;39(1):1-16. doi: 10.1038/s41388-019-0980-6. Epub 2019 Aug 28. Oncogene. 2020. PMID: 31462710 Review.
  • Emerging Autophagy Functions Shape the Tumor Microenvironment and Play a Role in Cancer Progression - Implications for Cancer Therapy.
    Bustos SO, Antunes F, Rangel MC, Chammas R. Bustos SO, et al. Front Oncol. 2020 Nov 25;10:606436. doi: 10.3389/fonc.2020.606436. eCollection 2020. Front Oncol. 2020. PMID: 33324568 Free PMC article. Review.
  • CD47 deficiency confers cell and tissue radioprotection by activation of autophagy.
    Soto-Pantoja DR, Miller TW, Pendrak ML, DeGraff WG, Sullivan C, Ridnour LA, Abu-Asab M, Wink DA, Tsokos M, Roberts DD. Soto-Pantoja DR, et al. Autophagy. 2012 Nov;8(11):1628-42. doi: 10.4161/auto.21562. Epub 2012 Aug 9. Autophagy. 2012. PMID: 22874555 Free PMC article.

References

    1. Chen Q, Gong B, Almasan A. Distinct stages of cytochrome c release from mitochondria: evidence for a feedback amplification loop linking caspase activation to mitochondrial dysfunction in genotoxic stress induced apoptosis. Cell Death Differ. 2000;7:227–233. doi: 10.1038/sj.cdd.4400629. - DOI - PMC - PubMed
    1. Maiuri MC, Zalckvar E, Kimchi A, Kroemer G. Self-eating and self-killing: crosstalk between autophagy and apoptosis. Nat Rev Mol Cell Biol. 2007;8:741–752. doi: 10.1038/nrm2239. - DOI - PubMed
    1. Yang Z, Klionsky DJ. Eaten alive: a history of macroautophagy. Nat Cell Biol. 2010;12:814–822. doi: 10.1038/ncb0910-814. - DOI - PMC - PubMed
    1. Shintani T, Klionsky DJ. Autophagy in health and disease: a double-edged sword. Science. 2004;306:990–995. doi: 10.1126/science.1099993. - DOI - PMC - PubMed
    1. Kraft C, Peter M, Hofmann K. Selective autophagy: ubiquitin-mediated recognition and beyond. Nat Cell Biol. 2010;12:836–841. doi: 10.1038/ncb0910-836. - DOI - PubMed

Publication types