. 2012 Mar;26(1):89-102.
doi: 10.3109/01677063.2011.642910. Epub 2012 Jan 12.

Mapping neural circuits with activity-dependent nuclear import of a transcription factor

Affiliations
Free PMC article

Mapping neural circuits with activity-dependent nuclear import of a transcription factor

Kaoru Masuyama et al. J Neurogenet. 2012 Mar.
Free PMC article

Abstract

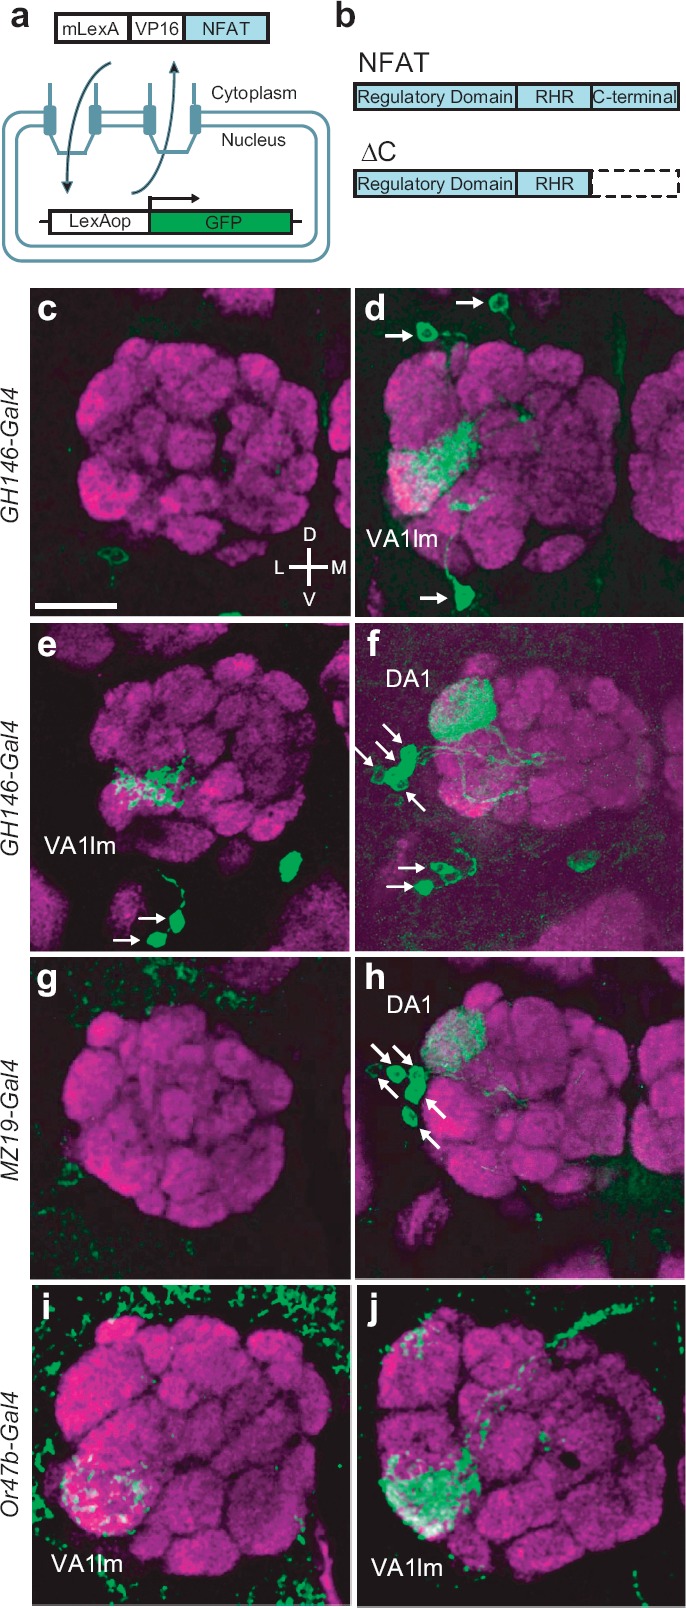
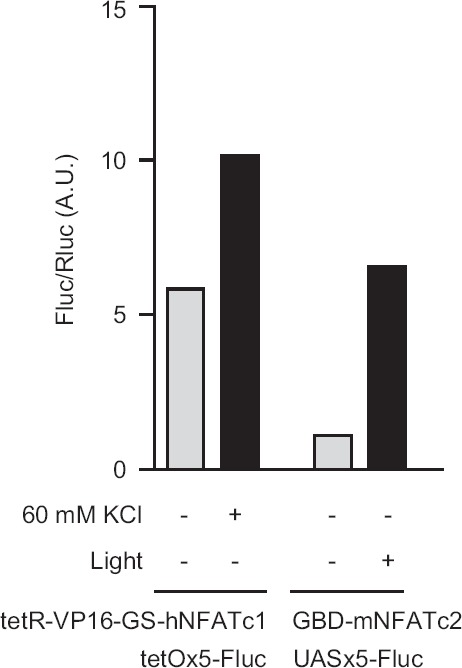
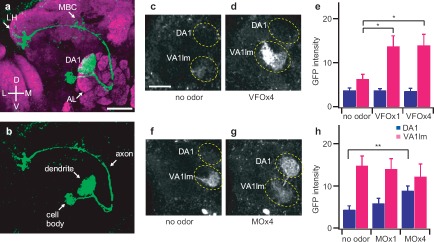
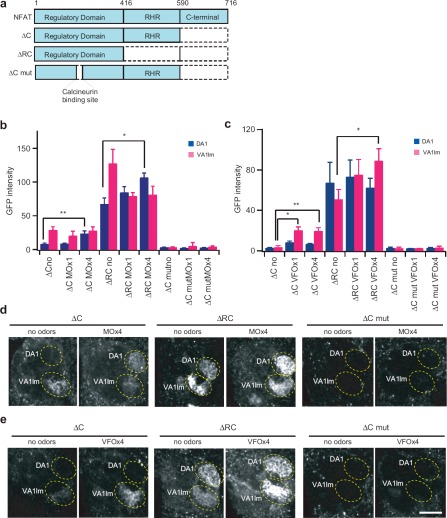
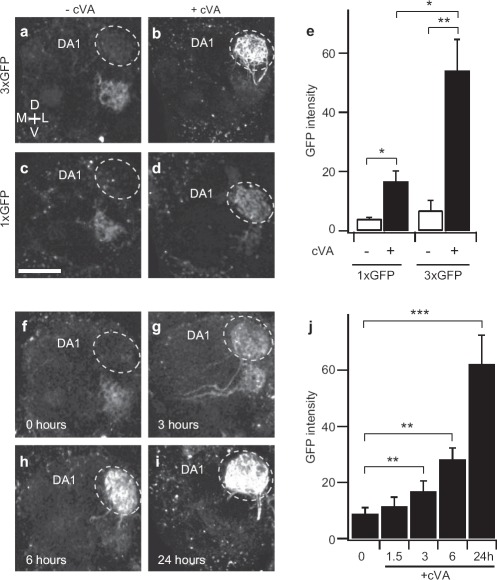
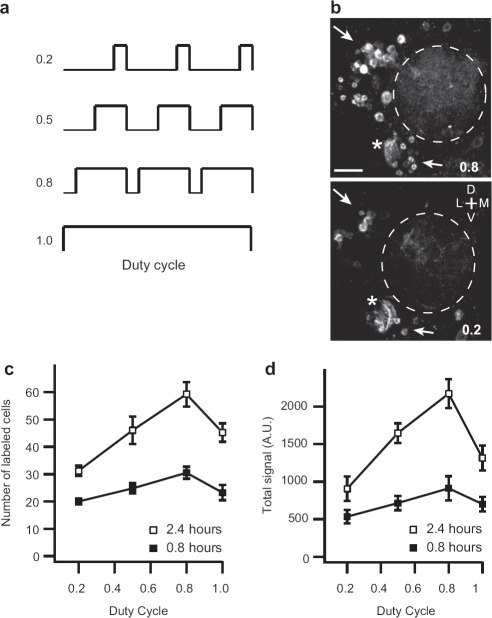
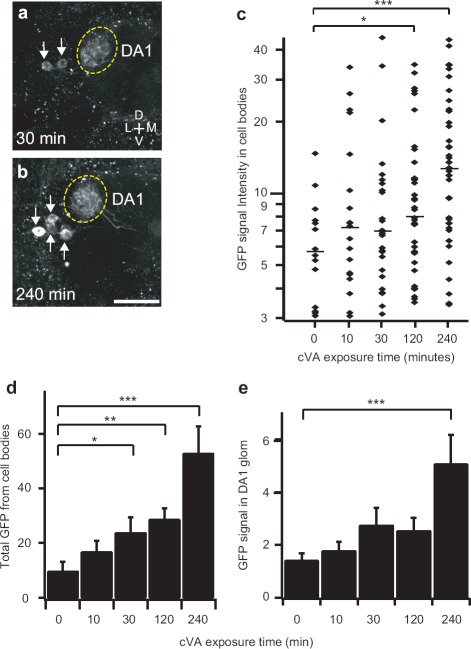
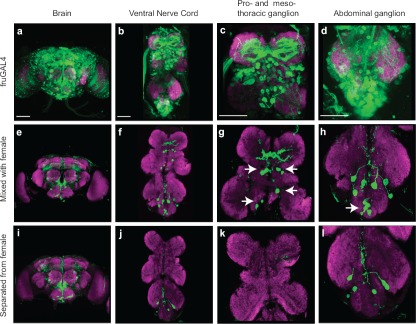
Abstract: Nuclear factor of activated T cells (NFAT) is a calcium-responsive transcription factor. We describe here an NFAT-based neural tracing method-CaLexA (calcium-dependent nuclear import of LexA)-for labeling active neurons in behaving animals. In this system, sustained neural activity induces nuclear import of the chimeric transcription factor LexA-VP16-NFAT, which in turn drives green fluorescent protein (GFP) reporter expression only in active neurons. We tested this system in Drosophila and found that volatile sex pheromones excite specific neurons in the olfactory circuit. Furthermore, complex courtship behavior associated with multi-modal sensory inputs activated neurons in the ventral nerve cord. This method harnessing the mechanism of activity-dependent nuclear import of a transcription factor can be used to identify active neurons in specific neuronal population in behaving animals.


Figures

Figure 1
Figure 1
The CaLexA system and active antennal lobe neurons in response to fly odors, (a) Schematic illustration of the CaLexA system. Calcium accumulation activates calcineurin that dephosphorylates NFAT, causing the chimeric transcription factor mLexA-VP16-NFAT to shuttle into the nucleus. Once inside the nucleus, the chimeric transcription factor induces expression of the GFP reporter gene, which is under the control of the LexA operator (LexAop). (b) Schematic illustration of NFATc1 molecule that is used for the CaLexA system. NFAT comprises three major segments that include the regulatory, the RHR DNA binding, and the C-terminal domains. NFAT sequence without the C-terminal domain (ΔC) is used to make mLexA-VP16-NFAT. (c-f) Confocal images of the antennal lobe of flies bearing the GH146-Gal4, UAS-mLexA-VP16-NFAT, LexAop-CD2-GFP, and LexAop-CD8-GFP-2A-CD8-GFP transgenes. (c, e) Images of unstimulated flies, (d) Image of a male fly exposed to the odor of 10 virgin female flies, (f) Image of a female fly exposed to the odor of 10 male flies, (g, h) Confocal images of the antennal lobe of female flies bearing MZ19-Gal4, UAS-mLexA-VP16-NFAT, LexAop-CD2-GFP, and LexAop-CD8-GFP-2A-CD8-GFP. (g) Image of an unstimulated fly. (h) Image of a fly exposed to the odor of 10 male flies, (i, j) Confocal images of the antennal lobe of male flies bearing Or47b-Gal4, UAS-mLexA-VP16-NFAT, LexAop-CD2-GFP, and LexAop-CD8-GFP-2A-CD8-GFP. (i) Image of an unstimulated fly. (j) Image of a fly exposed to the odor of 10 virgin female flies. Whole-mount brain preparations were stained with anti-GFP (green) and nc82 (a marker of neuropil, magenta) antibodies. For all images, dorsal (top), ventral (bottom), lateral (left), medial (right). Arrows indicate cell bodies of PNs. Scale bar = 20 μm.
Figure 2
Figure 2
Activity-induced reporter gene expression in N2A cells. For KC1 stimulation experiments, tetR-VP16-GS-hNFAT was co-expressed with tetO-Fluc and pRL-TK. When stimulated with 60 mM KC1, the FLuc/RLuc ratio increased nearly 2-fold. For light stimulation experiments, Gal4-NFATAD was co-expressed with VChR1, UAS-Fluc (pFR-Luc), and pRL-TK. After 488-nm light illumination for 12 hours, the Fluc/Rluc ratio increased by about 5-fold. Each data point represents average results from two samples.
Figure 3
Figure 3
Quantitative analysis of reporter gene expression in response to fly pheromones. (a) Confocal image of the DA1 PNs in response to a male pheromone, cVA. The test fly contained the following transgenes: MZ19-Gal4, UAS-mLexA-VP16-NFAT, LexAop-CD2-GFP, and LexAop-CD8-GFP-2A-CD8-GFP. Whole-mount brain preparations were stained with anti-GFP (green) and nc82 antibodies (magenta). AL = antennal lobe; LH = lateral horn; MBC = mushroom body calyx, (b) Confocal image of the DA1 PNs in response to male pheromone cVA with only green channel, (c, d) Two-photon microscopic images of GFP fluorescence in the antennal lobe of male flies in response to the odor of virgin female flies. Male flies contain GH146-Gal4, UAS-mLexA-VP16-NFAT, LexAop-CD2-GFP, and LexAop-CD8-GFP-2A-CD8-GFP. (e) Measurement of GFP fluorescence intensity in DA1 and VA1lm of male flies in response to female odor, n = 9–12. VFOx1 and VFOx4 indicate odors from one and four wild-type virgin female flies, respectively, (f, g) Two-photon microscopic images of GFP fluorescence in the antennal lobe of female flies in response to male odor. Female flies contain GH146-Gal4, UAS-mLexA-VP16-NFAT, LexAop-CD2-GFP, and LexAop-CD8-GFP-2A-CD8-GFP. (h) Measurement of GFP fluorescence intensity in DA1 and VA1lm of female flies in response to male odor, n = 10–14. MO × 1 and MO × 4 indicate male odors from one and four wild-type flies, respectively. Odor exposure lasted for 24 hours. GFP fluorescence intensity is displayed in arbitrary unit. Error bars indicate standard error of mean. *p < 0.05; **p < 0.01. Wilcoxon signed-rank test. All measurements were obtained from a custom two-photon microscope with the same laser power (61 mW at the back aperture of the objective lens) at the wavelength of 925 nm. Scale bar = 20 μm.
Figure 4
Figure 4
Comparison of different NFATc1 fragments for the CaLexA system, (a) The NFATc1 protein is comprised of three major segments that include the regulatory (aa 1–416), RHR DNA binding (aa 416–590), and C-terminal domains (aa 590–716). Different segments of the NFAT molecule were used to make the chimeric transcription factor for the CaLexA system. ΔC lacks the C-terminal; ARC lacks the RHR domain and the C-terminal. The regulatory domain contains calcineurin binding site. Six amino acids, PRIEIT, were deleted in the ΔC mutant construct, (b) GFP fluorescence intensity in DA1 and VA1lm of female flies in response to male odor. Female flies contain the GH146-Gal4, LexAop-CD2-GFP, and UAS-mLexA-VP16-NFAT transgenes. The ΔC version has the least background and best signal-to-noise ratio. MO × 1 and MO × 4 indicate male odor from one and four wild-type flies, respectively. n = 3–12. (c) GFP fluorescence intensity in DA1 and VA1lm of male flies in response to female odor. Male flies contain the GH146-Gal4, LexAop-CD2-GFP, and UAS-mLexA-VP16-NFAT transgenes. VFO × 1 and VFO × 4 indicate odor from one and four wild-type virgin female flies, respectively, n = 3–10. (d, e) Two-photon microscopic images of GFP fluorescence in the antennal lobe, (d) Images of neural activity patterns in the female fly brain after exposure to the male odor, (e) Images of neural activity patterns in the male fly brain after exposure to the female odor. Error bars indicate standard error of mean. *p < 0.05; **p < 0.01. Wilcoxon signed-rank test. All measurements were obtained from a custom two-photon microscope with the same laser power (86 mW at the back aperture of the objective lens) at the wavelength of 925 nm.
Figure 5
Figure 5
Increasing reporter gene copy number improves sensitivity of the CaLexA system, (a–e) Measurement of GFP fluorescence intensity in DA1 of female flies after exposed to cVA (20 μg) for 24 hours. The test fly contained GH146-Gal4, UAS-mLexA-VP16-NFAT, and LexAop-CD2-GFP (1 × GFP) or both LexAop-CD2-GFP and LexAop-CD8-GFP-2A-CD8-GFP (3 × GFP). (a–d) Images of GFP fluorescence in antennal lobe, (e) Quantitative analysis of GFP fluorescence in DA1. (f–i) Images of GFP fluorescence in antennal lobe, n = 6–9. (j) Quantitative analysis of GFP fluorescence in DA1. GFP fluorescence intensity is displayed in arbitrary unit, n = 6–9. Error bars indicate standard error of mean. *p < 0.05; **p < 0.01; ***p < 0.001. Wilcoxon signed-rank test. All measurements were obtained from a custom two-photon microscope with the same laser power (61 mW at the back aperture of the objective lens) at the wavelength of 925 nm. Scale bar = 20 μm.
Figure 6
Figure 6
Analysis of reporter gene expression with different stimulus protocols in response to CO2. (a) Stimulus protocols of varying duty cycles. Pulsed CO2 (25 mL/min, 160 seconds/cycle) was mixed into continuous airflow (50 mL/min). The total duration of CO2 exposure was either 0.8 or 2.4 hours, (b) Two-photon microscopy images of GFP fluorescence in antennal lobe. Analysis was performed at 12 hours after the start of CO2 exposure. Arrows indicate labeled cell bodies in flies with exposure to CO2 at different duty cycle, 0.8 (top) or 0.2 (bottom). Asterisks: antennal nerve. Dotted lines: antennal lobe. The test fly contained Elav-Gal4, UAS-mLexA-VP16-NFAT, LexAop-CD2-GFP, and LexAop-CD8-GFP-2A-CD8-GFP. (c, d) Total number (c) and total fluorescence (d) of labeled cells in flies exposed to CO2 for 0.8 (filled box) and 2.4 (opened box) hours at different duty cycles, n = 4. Error bars indicate standard error of the mean. All measurements were obtained from a custom two-photon microscope with the same laser power (86 mW at the back aperture of the objective lens) at the wavelength of 925 nm. Scale bar = 20 μm.
Figure 7
Figure 7
Quantitative analysis of reporter gene expression in PN cell bodies and dendrites. (a, b) Two-photon microscopy images of GFP fluorescence in antennal lobe. Arrows indicate PN cell bodies. Flies were exposed to cVA (20 μg) for 30 (a) or 240 (b) minutes. Images were obtained at 240 minutes. Results were from male flies containing MZ19-Gal4, UAS-mLexA-VP16-NFAT, LexAop-CD2-GFP, and LexAop-CD8-GFP-2A-CD8-GFP. (c-e) Analysis of GFP fluorescence intensity in cell bodies and dendrites of the DA1 PNs in flies exposed to cVA for different durations. Measurements for each exposure duration were obtained from 12 antennal lobes, (c) GFP fluorescence in the cell bodies. Horizontal bars: median values, (d) Total GFP fluorescence from all labeled cell bodies in each antennal lobe, (e) GFP fluorescence intensity (arbitrary unit) in PN dendrites of the DA1 glomerulus. Error bars indicate standard error of mean. *p < 0.05; **p < 0.01; ***p < 0.001. Wilcoxon signed-rank test. All measurements were obtained from a custom two-photon microscope with the same laser power (86 mW at the back aperture of the objective lens) at the wavelength of 925 nm. Scale bar = 20 μm.
Figure 8
Figure 8
Visualizing neural circuits underlying complex behavior, (a–d) Expression pattern of fruGAL4 in the brain and ventral nerve cord (VNC). The male fly contained fruGAL4 and UAS-CD8-GFP. (a) Expression of fruGAL4 in the brain, (b) Expression of fruGAL4 in the VNC. (c) Expression of fruGAL4 in the prothoracic ganglion and mesothoracic ganglion, (d) Expression of fruGAL4 in the abdominal ganglion, (e–h) GFP expression in the brain and VNC of a male fly that was mixed with virgin female flies. The test male fly contained fruGAL4, UAS-mLexA-VP16-NFAT, LexAop-CD2-GFP and LexAop-CD8-GFP-2A-CD8-GFP. (i–l) GFP expression in the brain and VNC of a male fly that was separated from virgin female flies by a nylon mesh. Whole-mount brain and VNC preparations were stained with anti-GFP (green) and nc82 (a marker of neuropil, magenta) antibodies. Arrows indicate the labeled cells that were correlated with courtship behavior. Scale bar = 50 μm.

Similar articles

Cited by

References

    1. Antony C, Jallon JM. The chemical basis for sex recognition in Drosophila melanogaster. J Insect Physiol. 1982;28:873.
    1. Ashraf SI, McLoon AL, Sclarsic SM, Kunes S. Synaptic protein synthesis associated with memory is regulated by the RISC pathway in Drosophila. Cell. 2006;124:191–205. - PubMed
    1. Baker BS, Taylor BJ, Hall JC. Are complex behaviors specified by dedicated regulatory genes? Reasoning from Drosophila. Cell. 2001;105:13–24. - PubMed
    1. Bartelt RJ, Schaner AM, Jackson LL. Cis-vaccenyl acetate as an aggregation pheromone in Drosophila melanogaster. J Chem Ecol. 1985;11:1747–1756. - PubMed
    1. Barth AL, Gerkin RC, Dean KL. Alteration of neuronal firing properties after in vivo experience in a FosGFP transgenic mouse. J Neurosci. 2004;24:6466–6475. - PMC - PubMed

Publication types

MeSH terms

Substances

LinkOut - more resources