Raf-1 levels determine the migration rate of primary endometrial stromal cells of patients with endometriosis
- PMID: 22225925
- PMCID: PMC3822983
- DOI: 10.1111/j.1582-4934.2011.01520.x
Raf-1 levels determine the migration rate of primary endometrial stromal cells of patients with endometriosis
Abstract
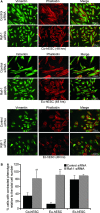
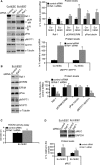
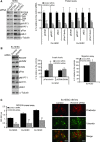
Endometriosis is a disease characterized by the localization of endometrial tissue outside the uterine cavity. The differences observed in migration of human endometrial stromal cells (hESC) obtained from patients with endometriosis versus healthy controls were proposed to correlate with the abnormal activation of Raf-1/ROCKII signalling pathway. To evaluate the mechanism by which Raf-1 regulates cytoskeleton reorganization and motility, we used primary eutopic (Eu-, n = 16) and ectopic (Ec-, n = 8; isolated from ovarian cysts) hESC of patients with endometriosis and endometriosis-free controls (Co-hESC, n = 14). Raf-1 siRNA knockdown in Co- and Eu-hESC resulted in contraction and decreased migration versus siRNA controls. This phenotype was reversed following the re-expression of Raf-1 in these cells. Lowest Raf-1 levels in Ec-hESC were associated with hyperactivated ROCKII and ezrin/radixin/moesin (E/R/M), impaired migration and a contracted phenotype similar to Raf-1 knockdown in Co- and Eu-hESC. We further show that the mechanism by which Raf-1 mediates migration in hESC includes direct myosin light chain phosphatase (MYPT1) phosphorylation and regulation of the levels of E/R/M, paxillin, MYPT1 and myosin light chain (MLC) phosphorylation indirectly via the hyperactivation of ROCKII kinase. Furthermore, we suggest that in contrast to Co-and Eu-hESC, where the cellular Raf-1 levels regulate the rate of migration, the low cellular Raf-1 content in Ec-hESC, might ensure their restricted migration by preserving the contracted cellular phenotype. In conclusion, our findings suggest that cellular levels of Raf-1 adjust the threshold of hESC migration in endometriosis.
© 2011 The Authors Journal of Cellular and Molecular Medicine © 2011 Foundation for Cellular and Molecular Medicine/Blackwell Publishing Ltd.
Figures


Similar articles
-
Abnormal activation of Ras/Raf/MAPK and RhoA/ROCKII signalling pathways in eutopic endometrial stromal cells of patients with endometriosis.Hum Reprod. 2011 Apr;26(4):885-97. doi: 10.1093/humrep/der010. Epub 2011 Feb 7. Hum Reprod. 2011. PMID: 21303778
-
USP10 promotes proliferation and migration and inhibits apoptosis of endometrial stromal cells in endometriosis through activating the Raf-1/MEK/ERK pathway.Am J Physiol Cell Physiol. 2018 Dec 1;315(6):C863-C872. doi: 10.1152/ajpcell.00272.2018. Epub 2018 Oct 3. Am J Physiol Cell Physiol. 2018. PMID: 30281322
-
Elevated phosphatase of regenerating liver 3 (PRL-3) promotes cytoskeleton reorganization, cell migration and invasion in endometrial stromal cells from endometrioma.Hum Reprod. 2016 Apr;31(4):723-33. doi: 10.1093/humrep/dew015. Epub 2016 Feb 13. Hum Reprod. 2016. PMID: 26874360
-
Raf-1, a potential therapeutic target, mediates early steps in endometriosis lesion development by endometrial epithelial and stromal cells.Endocrinology. 2012 Aug;153(8):3911-21. doi: 10.1210/en.2011-1879. Epub 2012 May 22. Endocrinology. 2012. PMID: 22619359
-
RNAi-mediated blocking of ezrin reduces migration of ectopic endometrial cells in endometriosis.Mol Hum Reprod. 2012 Sep;18(9):435-41. doi: 10.1093/molehr/gas019. Epub 2012 Apr 26. Mol Hum Reprod. 2012. PMID: 22544491
Cited by
-
Carboxypeptidase Inhibitor LXN Expression in Endometrial Tissue Is Menstrual Cycle Phase-Dependent and Is Upregulated in Endometriotic Lesions.Genes (Basel). 2024 Aug 17;15(8):1086. doi: 10.3390/genes15081086. Genes (Basel). 2024. PMID: 39202445 Free PMC article.
-
Insights of RKIP-Derived Suppression of Prostate Cancer.Cancers (Basel). 2021 Dec 20;13(24):6388. doi: 10.3390/cancers13246388. Cancers (Basel). 2021. PMID: 34945007 Free PMC article. Review.
-
Dysregulation of miR-202-3p Affects Migration and Invasion of Endometrial Stromal Cells in Endometriosis via Targeting ROCK1.Reprod Sci. 2020 Feb;27(2):731-742. doi: 10.1007/s43032-019-00079-4. Epub 2020 Jan 6. Reprod Sci. 2020. PMID: 32046445
-
C-Raf deficiency leads to hearing loss and increased noise susceptibility.Cell Mol Life Sci. 2015 Oct;72(20):3983-98. doi: 10.1007/s00018-015-1919-x. Epub 2015 May 15. Cell Mol Life Sci. 2015. PMID: 25975225 Free PMC article.
-
The involvement of osteopontin and matrix metalloproteinase- 9 in the migration of endometrial epithelial cells in patients with endometriosis.Reprod Biol Endocrinol. 2015 Aug 20;13:95. doi: 10.1186/s12958-015-0090-4. Reprod Biol Endocrinol. 2015. PMID: 26289107 Free PMC article.
References
-
- Berkley KJ, Rapkin AJ, Papka RE. The pains of endometriosis. Science. 2005;308:1587–9. - PubMed
-
- Giudice LC, Kao LC. Endometriosis. Lancet. 2004;364:1789–99. - PubMed
-
- Dunselman GA, Groothuis PG. Etiology of endometriosis: hypotheses and facts. Gynecol Obstet Invest. 2004;57:42–3. - PubMed
-
- Klemmt PA, Carver JG, Koninckx P, et al. Endometrial cells from women with endometriosis have increased adhesion and proliferative capacity in response to extracellular matrix components: towards a mechanistic model for endometriosis progression. Hum Reprod. 2007;22:3139–47. - PubMed
-
- Flamini MI, Sanchez AM, Genazzani AR, et al. Estrogen regulates endometrial cell cytoskeletal remodeling and motility via focal adhesion kinase. Fertil Steril. 2011;95:722–6. - PubMed
Publication types
MeSH terms
Substances
LinkOut - more resources
Full Text Sources
Other Literature Sources
Medical
Research Materials
Miscellaneous

