Novel adenovirus-based vaccines induce broad and sustained T cell responses to HCV in man
- PMID: 22218690
- PMCID: PMC3627207
- DOI: 10.1126/scitranslmed.3003155
Novel adenovirus-based vaccines induce broad and sustained T cell responses to HCV in man
Abstract
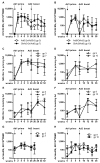
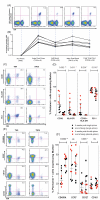
Currently, no vaccine exists for hepatitis C virus (HCV), a major pathogen thought to infect 170 million people globally. Many studies suggest that host T cell responses are critical for spontaneous resolution of disease, and preclinical studies have indicated a requirement for T cells in protection against challenge. We aimed to elicit HCV-specific T cells with the potential for protection using a recombinant adenoviral vector strategy in a phase 1 study of healthy human volunteers. Two adenoviral vectors expressing NS proteins from HCV genotype 1B were constructed based on rare serotypes [human adenovirus 6 (Ad6) and chimpanzee adenovirus 3 (ChAd3)]. Both vectors primed T cell responses against HCV proteins; these T cell responses targeted multiple proteins and were capable of recognizing heterologous strains (genotypes 1A and 3A). HCV-specific T cells consisted of both CD4+ and CD8+ T cell subsets; secreted interleukin-2, interferon-γ, and tumor necrosis factor-α; and could be sustained for at least a year after boosting with the heterologous adenoviral vector. Studies using major histocompatibility complex peptide tetramers revealed long-lived central and effector memory pools that retained polyfunctionality and proliferative capacity. These data indicate that an adenoviral vector strategy can induce sustained T cell responses of a magnitude and quality associated with protective immunity and open the way for studies of prophylactic and therapeutic vaccines for HCV.
Figures

Comment in
-
Hepatitis: HCV vaccine is successful in a phase I study in healthy volunteers.Nat Rev Gastroenterol Hepatol. 2012 Feb 7;9(3):126. doi: 10.1038/nrgastro.2012.12. Nat Rev Gastroenterol Hepatol. 2012. PMID: 22310919 No abstract available.
-
Viral disease: Steps towards an HCV vaccine.Nat Rev Drug Discov. 2012 Feb 17;11(3):187. doi: 10.1038/nrd3687. Nat Rev Drug Discov. 2012. PMID: 22338643 No abstract available.
Similar articles
-
A human vaccine strategy based on chimpanzee adenoviral and MVA vectors that primes, boosts, and sustains functional HCV-specific T cell memory.Sci Transl Med. 2014 Nov 5;6(261):261ra153. doi: 10.1126/scitranslmed.3009185. Sci Transl Med. 2014. PMID: 25378645 Free PMC article. Clinical Trial.
-
Enhanced and sustained CD8+ T cell responses with an adenoviral vector-based hepatitis C virus vaccine encoding NS3 linked to the MHC class II chaperone protein invariant chain.J Immunol. 2011 Feb 15;186(4):2355-64. doi: 10.4049/jimmunol.1001877. Epub 2011 Jan 21. J Immunol. 2011. PMID: 21257961
-
Combined adenovirus vector and hepatitis C virus envelope protein prime-boost regimen elicits T cell and neutralizing antibody immune responses.J Virol. 2014 May;88(10):5502-10. doi: 10.1128/JVI.03574-13. Epub 2014 Mar 5. J Virol. 2014. PMID: 24599994 Free PMC article.
-
Progress in the development of vaccines for hepatitis C virus infection.World J Gastroenterol. 2015 Nov 14;21(42):11984-2002. doi: 10.3748/wjg.v21.i42.11984. World J Gastroenterol. 2015. PMID: 26576087 Free PMC article. Review.
-
Progress in the development of preventive and therapeutic vaccines for hepatitis C virus.J Hepatol. 2011 Jun;54(6):1273-85. doi: 10.1016/j.jhep.2010.09.040. Epub 2011 Jan 12. J Hepatol. 2011. PMID: 21236312 Review.
Cited by
-
A Monovalent Chimpanzee Adenovirus Ebola Vaccine Boosted with MVA.N Engl J Med. 2016 Apr 28;374(17):1635-46. doi: 10.1056/NEJMoa1411627. Epub 2015 Jan 28. N Engl J Med. 2016. PMID: 25629663 Free PMC article. Clinical Trial.
-
Immediate Dysfunction of Vaccine-Elicited CD8+ T Cells Primed in the Absence of CD4+ T Cells.J Immunol. 2016 Sep 1;197(5):1809-22. doi: 10.4049/jimmunol.1600591. Epub 2016 Jul 22. J Immunol. 2016. PMID: 27448585 Free PMC article.
-
Ebola vaccines in clinical trial: The promising candidates.Hum Vaccin Immunother. 2017 Jan 2;13(1):153-168. doi: 10.1080/21645515.2016.1225637. Epub 2016 Oct 20. Hum Vaccin Immunother. 2017. PMID: 27764560 Free PMC article. Review.
-
High, broad, polyfunctional, and durable T cell immune responses induced in mice by a novel hepatitis C virus (HCV) vaccine candidate (MVA-HCV) based on modified vaccinia virus Ankara expressing the nearly full-length HCV genome.J Virol. 2013 Jul;87(13):7282-300. doi: 10.1128/JVI.03246-12. Epub 2013 Apr 17. J Virol. 2013. PMID: 23596307 Free PMC article.
-
Comparison of the inhibitory and stimulatory effects of Core and NS3 candidate HCV vaccines on the cellular immune response.Am J Clin Exp Immunol. 2023 Dec 15;12(6):153-163. eCollection 2023. Am J Clin Exp Immunol. 2023. PMID: 38187363 Free PMC article.
References
Publication types
MeSH terms
Substances
Grants and funding
LinkOut - more resources
Full Text Sources
Other Literature Sources
Medical
Molecular Biology Databases
Research Materials
Miscellaneous

