Role of histone tails in structural stability of the nucleosome
- PMID: 22207822
- PMCID: PMC3240580
- DOI: 10.1371/journal.pcbi.1002279
Role of histone tails in structural stability of the nucleosome
Abstract
Histone tails play an important role in nucleosome structure and dynamics. Here we investigate the effect of truncation of histone tails H3, H4, H2A and H2B on nucleosome structure with 100 ns all-atom molecular dynamics simulations. Tail domains of H3 and H2B show propensity of α-helics formation during the intact nucleosome simulation. On truncation of H4 or H2B tails no structural change occurs in histones. However, H3 or H2A tail truncation results in structural alterations in the histone core domain, and in both the cases the structural change occurs in the H2Aα3 domain. We also find that the contacts between the histone H2A C terminal docking domain and surrounding residues are destabilized upon H3 tail truncation. The relation between the present observations and corresponding experiments is discussed.
© 2011 Biswas et al.
Conflict of interest statement
The authors have declared that no competing interests exist.
Figures

 0.5, SHL
 1.5, etc. (positive in one direction, negative in the other).
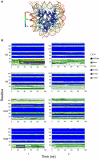
 -helices.
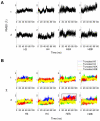
 of histone monomers H3, H4, H2A and H2B. (A) RMSDs for each of the two copies, 1 and 2, of the histone monomer backbone (excluding histone tails) versus simulation time for intact nucleosome. The last frame of the equilibration run was chosen as the reference structure. Trajectory frames were reoriented to the reference structure with least square fitting of backbone atoms (excluding tails). (B) Order parameter
  of each of the two copies (numbered 1 and 2) of histone monomers H3, H4, H2A and H2B for the four tail-truncated simulations. The reference structures used for RMSD calculations of the truncated and intact nucleosomes were aligned and had zero RMSD. The dotted lines indicate
  .
.
 domain shown by thickened helix. (B) Upper panel. Order parameter
  for H2A(2) fold domain from three independent H3 tail-truncated nucleosome simulations. Lower panel. Order parameter
  for H2A(2)
 domain from the H3 tail-truncated nucleosome simulation 1. (C) Upper panel. Order parameter
  for H2A(2) fold domain from two independent H2A tail-truncated nucleosome simulations. Lower panel. Order parameter
  for H2A(2)
 domain from the H2A tail-truncated nucleosome simulation 1.
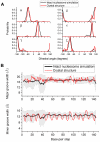
 (O3'-P-O5'-C5'),
  (P-O5'-C5'-C4'),
  (O5'-C5'-C4'-C3'),
  (C5'-C4'-C3'-O3'),
  (C4'-C3'-O3'-P) and
  (C3'-O3'-P-O5') obtained from the intact nucleosome simulation are compared with those from the crystal structure (1KX5.pdb). (B) DNA major and minor groove width fluctuations along the sequence (chain I) in the intact nucleosome simulation. Groove widths are calculated as P-P distances using the algorithm of Hassan and Calladine implemented in 3DNA
.
 for DNA from the four tail-truncated nucleosome simulations. The inset shows the order parameter for the DNA segment between the dyad and SHL +1.5 for the H3 tail-truncated nucleosome simulation. (B) The order parameter
  for DNA from three independent H3-tail truncated nucleosome simulations.
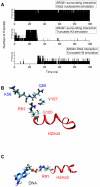
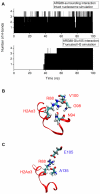

 -helix in H3 tail is shown in orange ribbons. (B) Snapshot from the H3 tail truncated simulation showing the Arg81 and Arg88 sidechain pointing towards the DNA in the absence of the H3 tail.

 Å) below which the C terminus is ‘in contact’ with the DNA.
 ) below which residues can be regarded to be in close contact.
 -helix (colored orange) and the DNA triggers change of interaction of histone arginines (Arg81 and Arg88). Newly formed polar contacts between Arg88, Glu105 and Gln112 destabilizes interaction of the H2A docking domain with closely lying amino acids (Ile51 and Gln55). Histone protein domains are shown as ribbons and DNA phosphorous atoms are shown as spheres. Histone domains are color coded as follows : H3
 N (blue), H2A
 3 (magenta), H2A
 C (grey), H2A docking domain (red).
Similar articles
-
Role of histone N-terminal tails and their acetylation in nucleosome dynamics.Mol Cell Biol. 2000 Oct;20(19):7230-7. doi: 10.1128/MCB.20.19.7230-7237.2000. Mol Cell Biol. 2000. PMID: 10982840 Free PMC article.
-
Effects of charge-modifying mutations in histone H2A α3-domain on nucleosome stability assessed by single-pair FRET and MD simulations.Sci Rep. 2017 Oct 16;7(1):13303. doi: 10.1038/s41598-017-13416-x. Sci Rep. 2017. PMID: 29038501 Free PMC article.
-
The N-terminal Tails of Histones H2A and H2B Adopt Two Distinct Conformations in the Nucleosome with Contact and Reduced Contact to DNA.J Mol Biol. 2021 Jul 23;433(15):167110. doi: 10.1016/j.jmb.2021.167110. Epub 2021 Jun 18. J Mol Biol. 2021. PMID: 34153285
-
Nucleosome adaptability conferred by sequence and structural variations in histone H2A-H2B dimers.Curr Opin Struct Biol. 2015 Jun;32:48-57. doi: 10.1016/j.sbi.2015.02.004. Epub 2015 Feb 27. Curr Opin Struct Biol. 2015. PMID: 25731851 Free PMC article. Review.
-
Histone tail network and modulation in a nucleosome.Curr Opin Struct Biol. 2022 Aug;75:102436. doi: 10.1016/j.sbi.2022.102436. Epub 2022 Jul 18. Curr Opin Struct Biol. 2022. PMID: 35863166 Review.
Cited by
-
Two arginine residues suppress the flexibility of nucleosomal DNA in the canonical nucleosome core.PLoS One. 2015 Mar 18;10(3):e0120635. doi: 10.1371/journal.pone.0120635. eCollection 2015. PLoS One. 2015. PMID: 25786215 Free PMC article.
-
Resonance assignment of disordered protein with repetitive and overlapping sequence using combinatorial approach reveals initial structural propensities and local restrictions in the denatured state.J Biomol NMR. 2016 Sep;66(1):21-35. doi: 10.1007/s10858-016-0054-9. Epub 2016 Sep 1. J Biomol NMR. 2016. PMID: 27586017
-
Nucleosomal DNA Dynamics Mediate Oct4 Pioneer Factor Binding.Biophys J. 2020 May 5;118(9):2280-2296. doi: 10.1016/j.bpj.2019.12.038. Epub 2020 Jan 16. Biophys J. 2020. PMID: 32027821 Free PMC article.
-
Close encounters with DNA.J Phys Condens Matter. 2014 Oct 15;26(41):413101. doi: 10.1088/0953-8984/26/41/413101. Epub 2014 Sep 19. J Phys Condens Matter. 2014. PMID: 25238560 Free PMC article. Review.
-
Shearing of the CENP-A dimerization interface mediates plasticity in the octameric centromeric nucleosome.Sci Rep. 2015 Nov 25;5:17038. doi: 10.1038/srep17038. Sci Rep. 2015. PMID: 26602160 Free PMC article.
References
-
- Olins AL, Olins DE. Spheroid chromatin units (v bodies). Science. 1974;183:330–332. - PubMed
-
- Davey CA, Sargent DF, Luger K, Maeder AW, Richmond TJ. Solvent mediated interactions in the structure of the nucleosome core particle at 1.9 å resolution. J Mol Biol. 2002;319:1097–1113. - PubMed
-
- Berger SL. The complex language of chromatin regulation during transcription. Nature. 2007;447:407–412. - PubMed
-
- Clapier CR, Cairns BR. The biology of chromatin remodeling complexes. Annu Rev Biochem. 2009;78:273–304. - PubMed
Publication types
MeSH terms
Substances
LinkOut - more resources
Full Text Sources
Miscellaneous

